Here's What's Concerning About Jilin Chemical Fibre StockLtd's (SZSE:000420) Returns On Capital


There are a few key trends to look for if we want to identify the next multi-bagger. Amongst other things, we'll want to see two things; firstly, a growing return on capital employed (ROCE) and secondly, an expansion in the company's amount of capital employed. This shows us that it's a compounding machine, able to continually reinvest its earnings back into the business and generate higher returns. Having said that, from a first glance at Jilin Chemical Fibre StockLtd (SZSE:000420) we aren't jumping out of our chairs at how returns are trending, but let's have a deeper look.
Understanding Return On Capital Employed (ROCE)
For those that aren't sure what ROCE is, it measures the amount of pre-tax profits a company can generate from the capital employed in its business. The formula for this calculation on Jilin Chemical Fibre StockLtd is:
Return on Capital Employed = Earnings Before Interest and Tax (EBIT) ÷ (Total Assets - Current Liabilities)
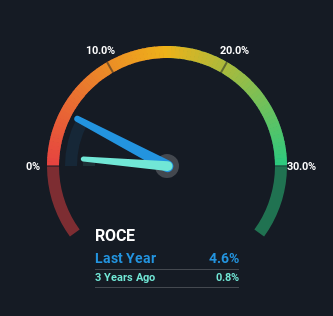
0.046 = CN¥264m ÷ (CN¥11b - CN¥5.1b) (Based on the trailing twelve months to September 2023).
Thus, Jilin Chemical Fibre StockLtd has an ROCE of 4.6%. In absolute terms, that's a low return and it also under-performs the Chemicals industry average of 5.9%.
See our latest analysis for Jilin Chemical Fibre StockLtd
Above you can see how the current ROCE for Jilin Chemical Fibre StockLtd compares to its prior returns on capital, but there's only so much you can tell from the past. If you're interested, you can view the analysts predictions in our free analyst report for Jilin Chemical Fibre StockLtd .
What Does the ROCE Trend For Jilin Chemical Fibre StockLtd Tell Us?
On the surface, the trend of ROCE at Jilin Chemical Fibre StockLtd doesn't inspire confidence. Around five years ago the returns on capital were 8.1%, but since then they've fallen to 4.6%. And considering revenue has dropped while employing more capital, we'd be cautious. If this were to continue, you might be looking at a company that is trying to reinvest for growth but is actually losing market share since sales haven't increased.
Another thing to note, Jilin Chemical Fibre StockLtd has a high ratio of current liabilities to total assets of 47%. This can bring about some risks because the company is basically operating with a rather large reliance on its suppliers or other sorts of short-term creditors. Ideally we'd like to see this reduce as that would mean fewer obligations bearing risks.
In Conclusion...
We're a bit apprehensive about Jilin Chemical Fibre StockLtd because despite more capital being deployed in the business, returns on that capital and sales have both fallen. Despite the concerning underlying trends, the stock has actually gained 18% over the last five years, so it might be that the investors are expecting the trends to reverse. Either way, we aren't huge fans of the current trends and so with that we think you might find better investments elsewhere.
Since virtually every company faces some risks, it's worth knowing what they are, and we've spotted 2 warning signs for Jilin Chemical Fibre StockLtd (of which 1 doesn't sit too well with us!) that you should know about.
For those who like to invest in solid companies, check out this free list of companies with solid balance sheets and high returns on equity.
New: Manage All Your Stock Portfolios in One Place
We've created the ultimate portfolio companion for stock investors, and it's free.
• Connect an unlimited number of Portfolios and see your total in one currency
• Be alerted to new Warning Signs or Risks via email or mobile
• Track the Fair Value of your stocks
Have feedback on this article? Concerned about the content? Get in touch with us directly. Alternatively, email editorial-team (at) simplywallst.com.
This article by Simply Wall St is general in nature. We provide commentary based on historical data and analyst forecasts only using an unbiased methodology and our articles are not intended to be financial advice. It does not constitute a recommendation to buy or sell any stock, and does not take account of your objectives, or your financial situation. We aim to bring you long-term focused analysis driven by fundamental data. Note that our analysis may not factor in the latest price-sensitive company announcements or qualitative material. Simply Wall St has no position in any stocks mentioned.
About SZSE:000420
Jilin Chemical Fibre StockLtd
Produces and sells chemical fiber in China.
Reasonable growth potential low.
Market Insights

Community Narratives

