Jinhong GasLtd's (SHSE:688106) Shareholders Have More To Worry About Than Only Soft Earnings

Last week's earnings announcement from Jinhong Gas Co.,Ltd. (SHSE:688106) was disappointing to investors, with a sluggish profit figure. We did some analysis, and found that there are some reasons to be cautious about the headline numbers.
See our latest analysis for Jinhong GasLtd

A Closer Look At Jinhong GasLtd's Earnings
One key financial ratio used to measure how well a company converts its profit to free cash flow (FCF) is the accrual ratio. In plain english, this ratio subtracts FCF from net profit, and divides that number by the company's average operating assets over that period. This ratio tells us how much of a company's profit is not backed by free cashflow.
As a result, a negative accrual ratio is a positive for the company, and a positive accrual ratio is a negative. That is not intended to imply we should worry about a positive accrual ratio, but it's worth noting where the accrual ratio is rather high. Notably, there is some academic evidence that suggests that a high accrual ratio is a bad sign for near-term profits, generally speaking.
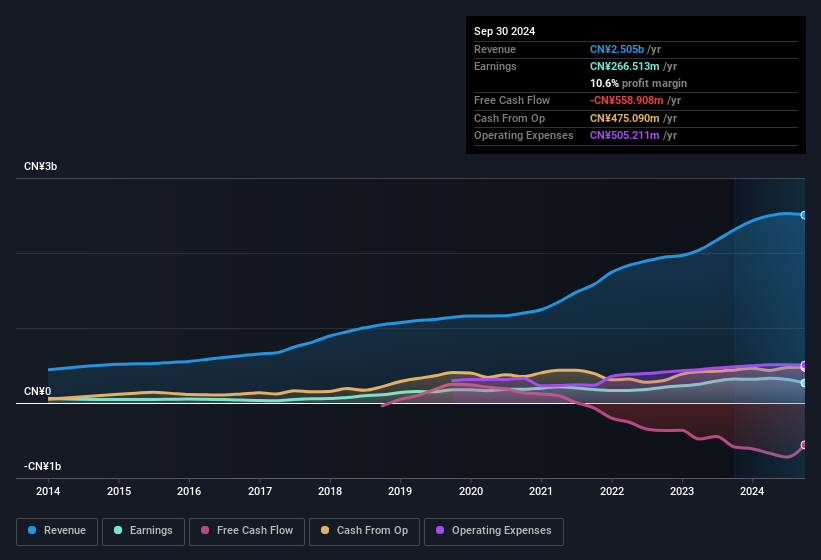
Over the twelve months to September 2024, Jinhong GasLtd recorded an accrual ratio of 0.22. We can therefore deduce that its free cash flow fell well short of covering its statutory profit. Even though it reported a profit of CN¥266.5m, a look at free cash flow indicates it actually burnt through CN¥559m in the last year. Coming off the back of negative free cash flow last year, we imagine some shareholders might wonder if its cash burn of CN¥559m, this year, indicates high risk. However, that's not all there is to consider. We can see that unusual items have impacted its statutory profit, and therefore the accrual ratio.
That might leave you wondering what analysts are forecasting in terms of future profitability. Luckily, you can click here to see an interactive graph depicting future profitability, based on their estimates.
How Do Unusual Items Influence Profit?
The fact that the company had unusual items boosting profit by CN¥44m, in the last year, probably goes some way to explain why its accrual ratio was so weak. While it's always nice to have higher profit, a large contribution from unusual items sometimes dampens our enthusiasm. We ran the numbers on most publicly listed companies worldwide, and it's very common for unusual items to be once-off in nature. And, after all, that's exactly what the accounting terminology implies. If Jinhong GasLtd doesn't see that contribution repeat, then all else being equal we'd expect its profit to drop over the current year.
Our Take On Jinhong GasLtd's Profit Performance
Summing up, Jinhong GasLtd received a nice boost to profit from unusual items, but could not match its paper profit with free cash flow. For the reasons mentioned above, we think that a perfunctory glance at Jinhong GasLtd's statutory profits might make it look better than it really is on an underlying level. With this in mind, we wouldn't consider investing in a stock unless we had a thorough understanding of the risks. Our analysis shows 2 warning signs for Jinhong GasLtd (1 is significant!) and we strongly recommend you look at these before investing.
Our examination of Jinhong GasLtd has focussed on certain factors that can make its earnings look better than they are. And, on that basis, we are somewhat skeptical. But there are plenty of other ways to inform your opinion of a company. Some people consider a high return on equity to be a good sign of a quality business. While it might take a little research on your behalf, you may find this free collection of companies boasting high return on equity, or this list of stocks with significant insider holdings to be useful.
If you're looking to trade Jinhong GasLtd, open an account with the lowest-cost platform trusted by professionals, Interactive Brokers.
With clients in over 200 countries and territories, and access to 160 markets, IBKR lets you trade stocks, options, futures, forex, bonds and funds from a single integrated account.
Enjoy no hidden fees, no account minimums, and FX conversion rates as low as 0.03%, far better than what most brokers offer.
Sponsored ContentNew: Manage All Your Stock Portfolios in One Place
We've created the ultimate portfolio companion for stock investors, and it's free.
• Connect an unlimited number of Portfolios and see your total in one currency
• Be alerted to new Warning Signs or Risks via email or mobile
• Track the Fair Value of your stocks
Have feedback on this article? Concerned about the content? Get in touch with us directly. Alternatively, email editorial-team (at) simplywallst.com.
This article by Simply Wall St is general in nature. We provide commentary based on historical data and analyst forecasts only using an unbiased methodology and our articles are not intended to be financial advice. It does not constitute a recommendation to buy or sell any stock, and does not take account of your objectives, or your financial situation. We aim to bring you long-term focused analysis driven by fundamental data. Note that our analysis may not factor in the latest price-sensitive company announcements or qualitative material. Simply Wall St has no position in any stocks mentioned.
About SHSE:688106
Jinhong GasLtd
Produces and sells bulk, special, and natural gas products in China.
Excellent balance sheet with reasonable growth potential.
Market Insights
Community Narratives


