
Advertisement
Ningbo Changhong Polymer Scientific and Technical (SHSE:605008) Could Be Struggling To Allocate Capital

If you're not sure where to start when looking for the next multi-bagger, there are a few key trends you should keep an eye out for. Firstly, we'll want to see a proven return on capital employed (ROCE) that is increasing, and secondly, an expanding base of capital employed. Put simply, these types of businesses are compounding machines, meaning they are continually reinvesting their earnings at ever-higher rates of return. Although, when we looked at Ningbo Changhong Polymer Scientific and Technical (SHSE:605008), it didn't seem to tick all of these boxes.
What Is Return On Capital Employed (ROCE)?
For those that aren't sure what ROCE is, it measures the amount of pre-tax profits a company can generate from the capital employed in its business. Analysts use this formula to calculate it for Ningbo Changhong Polymer Scientific and Technical:
Return on Capital Employed = Earnings Before Interest and Tax (EBIT) ÷ (Total Assets - Current Liabilities)
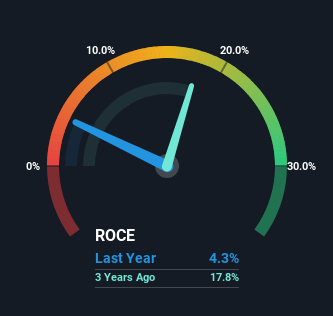
0.043 = CN¥134m ÷ (CN¥4.8b - CN¥1.7b) (Based on the trailing twelve months to March 2024).
So, Ningbo Changhong Polymer Scientific and Technical has an ROCE of 4.3%. Ultimately, that's a low return and it under-performs the Chemicals industry average of 5.8%.
View our latest analysis for Ningbo Changhong Polymer Scientific and Technical
While the past is not representative of the future, it can be helpful to know how a company has performed historically, which is why we have this chart above. If you want to delve into the historical earnings , check out these free graphs detailing revenue and cash flow performance of Ningbo Changhong Polymer Scientific and Technical.
What Can We Tell From Ningbo Changhong Polymer Scientific and Technical's ROCE Trend?
The trend of ROCE doesn't look fantastic because it's fallen from 22% five years ago, while the business's capital employed increased by 226%. That being said, Ningbo Changhong Polymer Scientific and Technical raised some capital prior to their latest results being released, so that could partly explain the increase in capital employed. It's unlikely that all of the funds raised have been put to work yet, so as a consequence Ningbo Changhong Polymer Scientific and Technical might not have received a full period of earnings contribution from it. Additionally, we found that Ningbo Changhong Polymer Scientific and Technical's most recent EBIT figure is around the same as the prior year, so we'd attribute the drop in ROCE mostly to the capital raise.
On a side note, Ningbo Changhong Polymer Scientific and Technical's current liabilities have increased over the last five years to 35% of total assets, effectively distorting the ROCE to some degree. Without this increase, it's likely that ROCE would be even lower than 4.3%. Keep an eye on this ratio, because the business could encounter some new risks if this metric gets too high.
Our Take On Ningbo Changhong Polymer Scientific and Technical's ROCE
Bringing it all together, while we're somewhat encouraged by Ningbo Changhong Polymer Scientific and Technical's reinvestment in its own business, we're aware that returns are shrinking. Since the stock has declined 13% over the last three years, investors may not be too optimistic on this trend improving either. All in all, the inherent trends aren't typical of multi-baggers, so if that's what you're after, we think you might have more luck elsewhere.
Ningbo Changhong Polymer Scientific and Technical does come with some risks though, we found 3 warning signs in our investment analysis, and 2 of those are a bit concerning...
For those who like to invest in solid companies, check out this free list of companies with solid balance sheets and high returns on equity.
Valuation is complex, but we're here to simplify it.
Discover if Ningbo Changhong Polymer Scientific and Technical might be undervalued or overvalued with our detailed analysis, featuring fair value estimates, potential risks, dividends, insider trades, and its financial condition.
Access Free AnalysisHave feedback on this article? Concerned about the content? Get in touch with us directly. Alternatively, email editorial-team (at) simplywallst.com.
This article by Simply Wall St is general in nature. We provide commentary based on historical data and analyst forecasts only using an unbiased methodology and our articles are not intended to be financial advice. It does not constitute a recommendation to buy or sell any stock, and does not take account of your objectives, or your financial situation. We aim to bring you long-term focused analysis driven by fundamental data. Note that our analysis may not factor in the latest price-sensitive company announcements or qualitative material. Simply Wall St has no position in any stocks mentioned.
About SHSE:605008
Ningbo Changhong Polymer Scientific and Technical
Ningbo Changhong Polymer Scientific and Technical Inc.
Reasonable growth potential low.
Market Insights

Advertisement
Community Narratives
WhiteCap Is Positioned To Profit Regardless Of Trump's Policy 
Fair Value CA$22.60|61.7% undervalued
ST
Equity Analyst and Writer
Microsoft's Evolution Will Drive Revenue to New Heights Fueled by AI
Fair Value US$360.00|28.9% overvalued
BR
Community Contributor
A CASE FOR USD$2.50 (CAD$3.44) BY 2028 (A 5-10 BAGGER)
Fair Value CA$3.44|88.1% undervalued
AG
Community Contributor