
Advertisement
Yongyue Science&Technology Co.,Ltd (SHSE:603879) May Have Run Too Fast Too Soon With Recent 29% Price Plummet
Yongyue Science&Technology Co.,Ltd (SHSE:603879) shares have had a horrible month, losing 29% after a relatively good period beforehand. The drop over the last 30 days has capped off a tough year for shareholders, with the share price down 14% in that time.
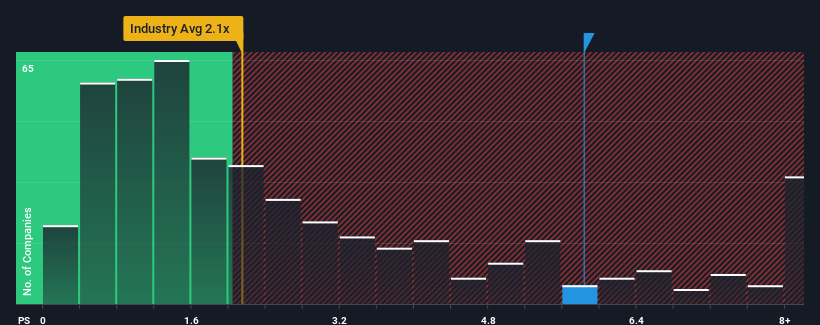
In spite of the heavy fall in price, when almost half of the companies in China's Chemicals industry have price-to-sales ratios (or "P/S") below 2.1x, you may still consider Yongyue Science&TechnologyLtd as a stock not worth researching with its 5.8x P/S ratio. Although, it's not wise to just take the P/S at face value as there may be an explanation why it's so lofty.
See our latest analysis for Yongyue Science&TechnologyLtd
How Has Yongyue Science&TechnologyLtd Performed Recently?
Revenue has risen at a steady rate over the last year for Yongyue Science&TechnologyLtd, which is generally not a bad outcome. One possibility is that the P/S ratio is high because investors think this good revenue growth will be enough to outperform the broader industry in the near future. You'd really hope so, otherwise you're paying a pretty hefty price for no particular reason.
Want the full picture on earnings, revenue and cash flow for the company? Then our free report on Yongyue Science&TechnologyLtd will help you shine a light on its historical performance.How Is Yongyue Science&TechnologyLtd's Revenue Growth Trending?
Yongyue Science&TechnologyLtd's P/S ratio would be typical for a company that's expected to deliver very strong growth, and importantly, perform much better than the industry.
Taking a look back first, we see that the company managed to grow revenues by a handy 5.1% last year. Ultimately though, it couldn't turn around the poor performance of the prior period, with revenue shrinking 15% in total over the last three years. Accordingly, shareholders would have felt downbeat about the medium-term rates of revenue growth.
In contrast to the company, the rest of the industry is expected to grow by 21% over the next year, which really puts the company's recent medium-term revenue decline into perspective.
In light of this, it's alarming that Yongyue Science&TechnologyLtd's P/S sits above the majority of other companies. Apparently many investors in the company are way more bullish than recent times would indicate and aren't willing to let go of their stock at any price. There's a very good chance existing shareholders are setting themselves up for future disappointment if the P/S falls to levels more in line with the recent negative growth rates.
What Does Yongyue Science&TechnologyLtd's P/S Mean For Investors?
Yongyue Science&TechnologyLtd's shares may have suffered, but its P/S remains high. It's argued the price-to-sales ratio is an inferior measure of value within certain industries, but it can be a powerful business sentiment indicator.
Our examination of Yongyue Science&TechnologyLtd revealed its shrinking revenue over the medium-term isn't resulting in a P/S as low as we expected, given the industry is set to grow. When we see revenue heading backwards and underperforming the industry forecasts, we feel the possibility of the share price declining is very real, bringing the P/S back into the realm of reasonability. Unless the the circumstances surrounding the recent medium-term improve, it wouldn't be wrong to expect a a difficult period ahead for the company's shareholders.
Before you take the next step, you should know about the 2 warning signs for Yongyue Science&TechnologyLtd that we have uncovered.
If strong companies turning a profit tickle your fancy, then you'll want to check out this free list of interesting companies that trade on a low P/E (but have proven they can grow earnings).
New: Manage All Your Stock Portfolios in One Place
We've created the ultimate portfolio companion for stock investors, and it's free.
• Connect an unlimited number of Portfolios and see your total in one currency
• Be alerted to new Warning Signs or Risks via email or mobile
• Track the Fair Value of your stocks
Have feedback on this article? Concerned about the content? Get in touch with us directly. Alternatively, email editorial-team (at) simplywallst.com.
This article by Simply Wall St is general in nature. We provide commentary based on historical data and analyst forecasts only using an unbiased methodology and our articles are not intended to be financial advice. It does not constitute a recommendation to buy or sell any stock, and does not take account of your objectives, or your financial situation. We aim to bring you long-term focused analysis driven by fundamental data. Note that our analysis may not factor in the latest price-sensitive company announcements or qualitative material. Simply Wall St has no position in any stocks mentioned.
About SHSE:603879
Yongyue Science&TechnologyLtd
Engages in the research and development, production, and sale of synthetic resins in China.
Flawless balance sheet with minimal risk.
Market Insights

Advertisement
Community Narratives
MINISO's fair value is projected at 26.69 with an anticipated PE ratio shift of 20x
Fair Value US$24.03|11.0% undervalued
BE
Community Contributor
Procter & Gamble: A Dividend Giant Facing Slowing Growth
Fair Value US$119.81|23.3% overvalued
AN
Community Contributor
Eli Lilly's Future Growth Driven by Tirzepatide and Favorable Market Conditions
Fair Value US$1.19k|13.8% undervalued
EA
Community Contributor