
Advertisement
Sanxiang Advanced Materials (SHSE:603663) Has A Somewhat Strained Balance Sheet
Legendary fund manager Li Lu (who Charlie Munger backed) once said, 'The biggest investment risk is not the volatility of prices, but whether you will suffer a permanent loss of capital.' It's only natural to consider a company's balance sheet when you examine how risky it is, since debt is often involved when a business collapses. As with many other companies Sanxiang Advanced Materials Co., Ltd. (SHSE:603663) makes use of debt. But the real question is whether this debt is making the company risky.
When Is Debt A Problem?
Debt assists a business until the business has trouble paying it off, either with new capital or with free cash flow. Part and parcel of capitalism is the process of 'creative destruction' where failed businesses are mercilessly liquidated by their bankers. However, a more common (but still painful) scenario is that it has to raise new equity capital at a low price, thus permanently diluting shareholders. Having said that, the most common situation is where a company manages its debt reasonably well - and to its own advantage. The first step when considering a company's debt levels is to consider its cash and debt together.
Check out our latest analysis for Sanxiang Advanced Materials
How Much Debt Does Sanxiang Advanced Materials Carry?
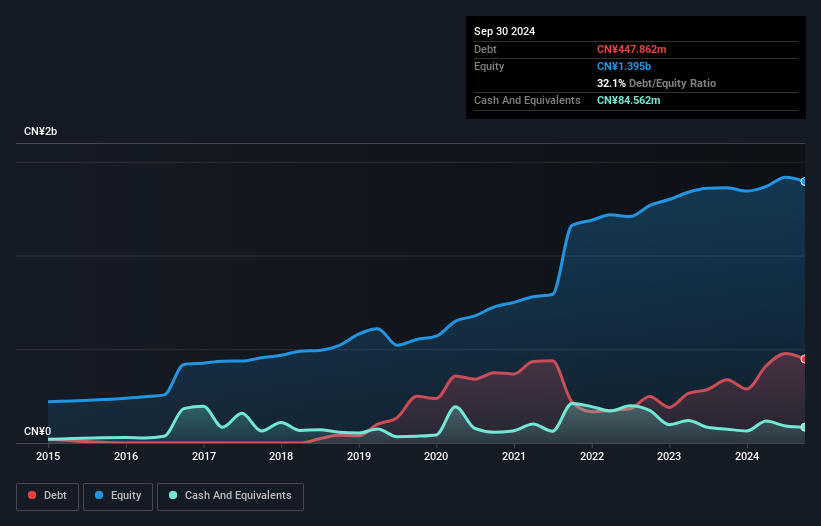
The image below, which you can click on for greater detail, shows that at September 2024 Sanxiang Advanced Materials had debt of CN¥447.9m, up from CN¥336.7m in one year. However, it does have CN¥84.6m in cash offsetting this, leading to net debt of about CN¥363.3m.
How Healthy Is Sanxiang Advanced Materials' Balance Sheet?
According to the last reported balance sheet, Sanxiang Advanced Materials had liabilities of CN¥731.8m due within 12 months, and liabilities of CN¥38.9m due beyond 12 months. Offsetting these obligations, it had cash of CN¥84.6m as well as receivables valued at CN¥515.3m due within 12 months. So its liabilities total CN¥170.8m more than the combination of its cash and short-term receivables.
Of course, Sanxiang Advanced Materials has a market capitalization of CN¥7.65b, so these liabilities are probably manageable. However, we do think it is worth keeping an eye on its balance sheet strength, as it may change over time.
We use two main ratios to inform us about debt levels relative to earnings. The first is net debt divided by earnings before interest, tax, depreciation, and amortization (EBITDA), while the second is how many times its earnings before interest and tax (EBIT) covers its interest expense (or its interest cover, for short). The advantage of this approach is that we take into account both the absolute quantum of debt (with net debt to EBITDA) and the actual interest expenses associated with that debt (with its interest cover ratio).
Sanxiang Advanced Materials has net debt to EBITDA of 2.6 suggesting it uses a fair bit of leverage to boost returns. But the high interest coverage of 9.3 suggests it can easily service that debt. Shareholders should be aware that Sanxiang Advanced Materials's EBIT was down 54% last year. If that decline continues then paying off debt will be harder than selling foie gras at a vegan convention. The balance sheet is clearly the area to focus on when you are analysing debt. But ultimately the future profitability of the business will decide if Sanxiang Advanced Materials can strengthen its balance sheet over time. So if you want to see what the professionals think, you might find this free report on analyst profit forecasts to be interesting.
Finally, while the tax-man may adore accounting profits, lenders only accept cold hard cash. So we always check how much of that EBIT is translated into free cash flow. Over the last three years, Sanxiang Advanced Materials recorded negative free cash flow, in total. Debt is usually more expensive, and almost always more risky in the hands of a company with negative free cash flow. Shareholders ought to hope for an improvement.
Our View
Both Sanxiang Advanced Materials's EBIT growth rate and its conversion of EBIT to free cash flow were discouraging. But at least its interest cover is a gleaming silver lining to those clouds. When we consider all the factors discussed, it seems to us that Sanxiang Advanced Materials is taking some risks with its use of debt. So while that leverage does boost returns on equity, we wouldn't really want to see it increase from here. Over time, share prices tend to follow earnings per share, so if you're interested in Sanxiang Advanced Materials, you may well want to click here to check an interactive graph of its earnings per share history.
If you're interested in investing in businesses that can grow profits without the burden of debt, then check out this free list of growing businesses that have net cash on the balance sheet.
New: Manage All Your Stock Portfolios in One Place
We've created the ultimate portfolio companion for stock investors, and it's free.
• Connect an unlimited number of Portfolios and see your total in one currency
• Be alerted to new Warning Signs or Risks via email or mobile
• Track the Fair Value of your stocks
Have feedback on this article? Concerned about the content? Get in touch with us directly. Alternatively, email editorial-team (at) simplywallst.com.
This article by Simply Wall St is general in nature. We provide commentary based on historical data and analyst forecasts only using an unbiased methodology and our articles are not intended to be financial advice. It does not constitute a recommendation to buy or sell any stock, and does not take account of your objectives, or your financial situation. We aim to bring you long-term focused analysis driven by fundamental data. Note that our analysis may not factor in the latest price-sensitive company announcements or qualitative material. Simply Wall St has no position in any stocks mentioned.
About SHSE:603663
Sanxiang Advanced Materials
Engages in the manufacture and sale of fused zirconia, cast modified materials, and single crystal fused aluminum materials.
Flawless balance sheet with limited growth.
Market Insights

Advertisement
Community Narratives
Finding The True Value Of A Logistics Powerhouse
Fair Value US$95.21|8.7% undervalued
NV
Community Contributor
Paradigm Biopharmaceuticals Will Lead Osteoarthritis Treatment with Zilosul's FDA Success
Fair Value AU$5.50|93.3% undervalued
AM
Community Contributor
Barrick Mining (ABX:CA): A Gold Hedge against a U.S. Shutdown
Fair Value CA$60.00|18.7% undervalued
GM
Community Contributor