
Advertisement
Sanxiang Advanced Materials Co., Ltd.'s (SHSE:603663) 25% Dip Still Leaving Some Shareholders Feeling Restless Over Its P/SRatio
The Sanxiang Advanced Materials Co., Ltd. (SHSE:603663) share price has softened a substantial 25% over the previous 30 days, handing back much of the gains the stock has made lately. Still, a bad month hasn't completely ruined the past year with the stock gaining 43%, which is great even in a bull market.
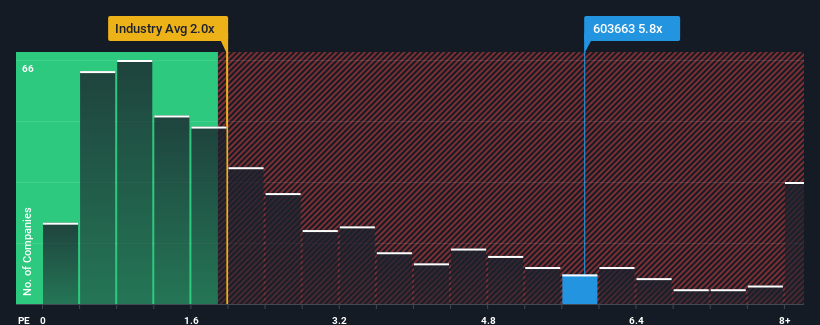
Although its price has dipped substantially, when almost half of the companies in China's Chemicals industry have price-to-sales ratios (or "P/S") below 2x, you may still consider Sanxiang Advanced Materials as a stock not worth researching with its 5.8x P/S ratio. However, the P/S might be quite high for a reason and it requires further investigation to determine if it's justified.
Check out our latest analysis for Sanxiang Advanced Materials
How Sanxiang Advanced Materials Has Been Performing
For instance, Sanxiang Advanced Materials' receding revenue in recent times would have to be some food for thought. Perhaps the market believes the company can do enough to outperform the rest of the industry in the near future, which is keeping the P/S ratio high. However, if this isn't the case, investors might get caught out paying too much for the stock.
Although there are no analyst estimates available for Sanxiang Advanced Materials, take a look at this free data-rich visualisation to see how the company stacks up on earnings, revenue and cash flow.Do Revenue Forecasts Match The High P/S Ratio?
The only time you'd be truly comfortable seeing a P/S as steep as Sanxiang Advanced Materials' is when the company's growth is on track to outshine the industry decidedly.
In reviewing the last year of financials, we were disheartened to see the company's revenues fell to the tune of 4.7%. Even so, admirably revenue has lifted 33% in aggregate from three years ago, notwithstanding the last 12 months. Although it's been a bumpy ride, it's still fair to say the revenue growth recently has been more than adequate for the company.
Comparing the recent medium-term revenue trends against the industry's one-year growth forecast of 23% shows it's noticeably less attractive.
In light of this, it's alarming that Sanxiang Advanced Materials' P/S sits above the majority of other companies. Apparently many investors in the company are way more bullish than recent times would indicate and aren't willing to let go of their stock at any price. There's a good chance existing shareholders are setting themselves up for future disappointment if the P/S falls to levels more in line with recent growth rates.
What Does Sanxiang Advanced Materials' P/S Mean For Investors?
Sanxiang Advanced Materials' shares may have suffered, but its P/S remains high. Using the price-to-sales ratio alone to determine if you should sell your stock isn't sensible, however it can be a practical guide to the company's future prospects.
The fact that Sanxiang Advanced Materials currently trades on a higher P/S relative to the industry is an oddity, since its recent three-year growth is lower than the wider industry forecast. When we see slower than industry revenue growth but an elevated P/S, there's considerable risk of the share price declining, sending the P/S lower. If recent medium-term revenue trends continue, it will place shareholders' investments at significant risk and potential investors in danger of paying an excessive premium.
Plus, you should also learn about these 2 warning signs we've spotted with Sanxiang Advanced Materials (including 1 which makes us a bit uncomfortable).
It's important to make sure you look for a great company, not just the first idea you come across. So if growing profitability aligns with your idea of a great company, take a peek at this free list of interesting companies with strong recent earnings growth (and a low P/E).
New: Manage All Your Stock Portfolios in One Place
We've created the ultimate portfolio companion for stock investors, and it's free.
• Connect an unlimited number of Portfolios and see your total in one currency
• Be alerted to new Warning Signs or Risks via email or mobile
• Track the Fair Value of your stocks
Have feedback on this article? Concerned about the content? Get in touch with us directly. Alternatively, email editorial-team (at) simplywallst.com.
This article by Simply Wall St is general in nature. We provide commentary based on historical data and analyst forecasts only using an unbiased methodology and our articles are not intended to be financial advice. It does not constitute a recommendation to buy or sell any stock, and does not take account of your objectives, or your financial situation. We aim to bring you long-term focused analysis driven by fundamental data. Note that our analysis may not factor in the latest price-sensitive company announcements or qualitative material. Simply Wall St has no position in any stocks mentioned.
About SHSE:603663
Sanxiang Advanced Materials
Engages in the manufacture and sale of fused zirconia, cast modified materials, and single crystal fused aluminum materials.
Flawless balance sheet with limited growth.
Market Insights

Advertisement
Community Narratives
Finding The True Value Of A Logistics Powerhouse
Fair Value US$95.21|8.7% undervalued
NV
Community Contributor
Paradigm Biopharmaceuticals Will Lead Osteoarthritis Treatment with Zilosul's FDA Success
Fair Value AU$5.50|93.1% undervalued
AM
Community Contributor
Barrick Mining (ABX:CA): A Gold Hedge against a U.S. Shutdown
Fair Value CA$60.00|18.7% undervalued
GM
Community Contributor