
Advertisement
Shanghai Sunglow Packaging Technology Co.,Ltd's (SHSE:603499) 29% Dip Still Leaving Some Shareholders Feeling Restless Over Its P/SRatio
Unfortunately for some shareholders, the Shanghai Sunglow Packaging Technology Co.,Ltd (SHSE:603499) share price has dived 29% in the last thirty days, prolonging recent pain. Still, a bad month hasn't completely ruined the past year with the stock gaining 33%, which is great even in a bull market.
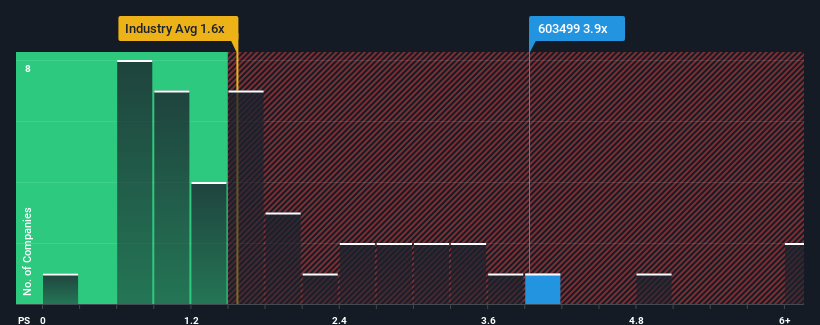
In spite of the heavy fall in price, you could still be forgiven for thinking Shanghai Sunglow Packaging TechnologyLtd is a stock to steer clear of with a price-to-sales ratios (or "P/S") of 3.9x, considering almost half the companies in China's Packaging industry have P/S ratios below 1.6x. However, the P/S might be quite high for a reason and it requires further investigation to determine if it's justified.
View our latest analysis for Shanghai Sunglow Packaging TechnologyLtd
What Does Shanghai Sunglow Packaging TechnologyLtd's Recent Performance Look Like?
Shanghai Sunglow Packaging TechnologyLtd has been doing a decent job lately as it's been growing revenue at a reasonable pace. One possibility is that the P/S ratio is high because investors think this good revenue growth will be enough to outperform the broader industry in the near future. You'd really hope so, otherwise you're paying a pretty hefty price for no particular reason.
Although there are no analyst estimates available for Shanghai Sunglow Packaging TechnologyLtd, take a look at this free data-rich visualisation to see how the company stacks up on earnings, revenue and cash flow.What Are Revenue Growth Metrics Telling Us About The High P/S?
In order to justify its P/S ratio, Shanghai Sunglow Packaging TechnologyLtd would need to produce outstanding growth that's well in excess of the industry.
Retrospectively, the last year delivered a decent 5.0% gain to the company's revenues. Pleasingly, revenue has also lifted 31% in aggregate from three years ago, partly thanks to the last 12 months of growth. Accordingly, shareholders would have definitely welcomed those medium-term rates of revenue growth.
Comparing the recent medium-term revenue trends against the industry's one-year growth forecast of 20% shows it's noticeably less attractive.
In light of this, it's alarming that Shanghai Sunglow Packaging TechnologyLtd's P/S sits above the majority of other companies. Apparently many investors in the company are way more bullish than recent times would indicate and aren't willing to let go of their stock at any price. There's a good chance existing shareholders are setting themselves up for future disappointment if the P/S falls to levels more in line with recent growth rates.
The Bottom Line On Shanghai Sunglow Packaging TechnologyLtd's P/S
A significant share price dive has done very little to deflate Shanghai Sunglow Packaging TechnologyLtd's very lofty P/S. It's argued the price-to-sales ratio is an inferior measure of value within certain industries, but it can be a powerful business sentiment indicator.
The fact that Shanghai Sunglow Packaging TechnologyLtd currently trades on a higher P/S relative to the industry is an oddity, since its recent three-year growth is lower than the wider industry forecast. When we see slower than industry revenue growth but an elevated P/S, there's considerable risk of the share price declining, sending the P/S lower. If recent medium-term revenue trends continue, it will place shareholders' investments at significant risk and potential investors in danger of paying an excessive premium.
There are also other vital risk factors to consider and we've discovered 5 warning signs for Shanghai Sunglow Packaging TechnologyLtd (1 doesn't sit too well with us!) that you should be aware of before investing here.
It's important to make sure you look for a great company, not just the first idea you come across. So if growing profitability aligns with your idea of a great company, take a peek at this free list of interesting companies with strong recent earnings growth (and a low P/E).
New: Manage All Your Stock Portfolios in One Place
We've created the ultimate portfolio companion for stock investors, and it's free.
• Connect an unlimited number of Portfolios and see your total in one currency
• Be alerted to new Warning Signs or Risks via email or mobile
• Track the Fair Value of your stocks
Have feedback on this article? Concerned about the content? Get in touch with us directly. Alternatively, email editorial-team (at) simplywallst.com.
This article by Simply Wall St is general in nature. We provide commentary based on historical data and analyst forecasts only using an unbiased methodology and our articles are not intended to be financial advice. It does not constitute a recommendation to buy or sell any stock, and does not take account of your objectives, or your financial situation. We aim to bring you long-term focused analysis driven by fundamental data. Note that our analysis may not factor in the latest price-sensitive company announcements or qualitative material. Simply Wall St has no position in any stocks mentioned.
Have feedback on this article? Concerned about the content? Get in touch with us directly. Alternatively, email editorial-team@simplywallst.com
About SHSE:603499
Shanghai Sunglow Packaging TechnologyLtd
Engages in the research, development, manufacture, and sale of packaging and printing products in China.
Solid track record with adequate balance sheet.
Market Insights

Advertisement
Community Narratives
The Next Phase of Energy Storage: How NeoVolta Is Tackling America’s Power Crunch
Fair Value US$7.50|30.4% undervalued
MA
Community Contributor
Why EnSilica is Worth Possibly 13x its Current Price
Fair Value UK£5.00|89.5% undervalued
DO
Community Contributor
M&A Activity, Industry Diversification & A Defense Contract Monopoly Will Push BWXT For Healthy Long-Term Growth
Fair Value US$220.00|13.0% undervalued
CL
Community Contributor
A case for Cassiar Gold Corp (TSXV: GLDC) to reach CAD$8-10 before 2030 (X30-37)
Fair Value CA$10.00|96.5% undervalued
AG
Community Contributor