Yuanli Chemical Group Co.,Ltd.'s (SHSE:603217) Shares Bounce 26% But Its Business Still Trails The Market


Yuanli Chemical Group Co.,Ltd. (SHSE:603217) shareholders are no doubt pleased to see that the share price has bounced 26% in the last month, although it is still struggling to make up recently lost ground. But the last month did very little to improve the 51% share price decline over the last year.
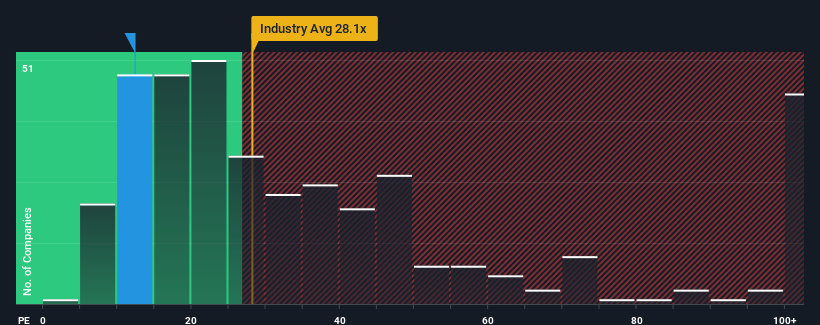
In spite of the firm bounce in price, Yuanli Chemical GroupLtd may still be sending very bullish signals at the moment with its price-to-earnings (or "P/E") ratio of 12.3x, since almost half of all companies in China have P/E ratios greater than 30x and even P/E's higher than 55x are not unusual. Although, it's not wise to just take the P/E at face value as there may be an explanation why it's so limited.
With earnings that are retreating more than the market's of late, Yuanli Chemical GroupLtd has been very sluggish. It seems that many are expecting the dismal earnings performance to persist, which has repressed the P/E. If you still like the company, you'd want its earnings trajectory to turn around before making any decisions. Or at the very least, you'd be hoping the earnings slide doesn't get any worse if your plan is to pick up some stock while it's out of favour.
View our latest analysis for Yuanli Chemical GroupLtd
Is There Any Growth For Yuanli Chemical GroupLtd?
There's an inherent assumption that a company should far underperform the market for P/E ratios like Yuanli Chemical GroupLtd's to be considered reasonable.
Taking a look back first, the company's earnings per share growth last year wasn't something to get excited about as it posted a disappointing decline of 35%. However, a few very strong years before that means that it was still able to grow EPS by an impressive 102% in total over the last three years. Accordingly, while they would have preferred to keep the run going, shareholders would probably welcome the medium-term rates of earnings growth.
Shifting to the future, estimates from the one analyst covering the company suggest earnings should grow by 24% over the next year. Meanwhile, the rest of the market is forecast to expand by 41%, which is noticeably more attractive.
In light of this, it's understandable that Yuanli Chemical GroupLtd's P/E sits below the majority of other companies. It seems most investors are expecting to see limited future growth and are only willing to pay a reduced amount for the stock.
What We Can Learn From Yuanli Chemical GroupLtd's P/E?
Even after such a strong price move, Yuanli Chemical GroupLtd's P/E still trails the rest of the market significantly. While the price-to-earnings ratio shouldn't be the defining factor in whether you buy a stock or not, it's quite a capable barometer of earnings expectations.
As we suspected, our examination of Yuanli Chemical GroupLtd's analyst forecasts revealed that its inferior earnings outlook is contributing to its low P/E. Right now shareholders are accepting the low P/E as they concede future earnings probably won't provide any pleasant surprises. Unless these conditions improve, they will continue to form a barrier for the share price around these levels.
Having said that, be aware Yuanli Chemical GroupLtd is showing 3 warning signs in our investment analysis, you should know about.
If these risks are making you reconsider your opinion on Yuanli Chemical GroupLtd, explore our interactive list of high quality stocks to get an idea of what else is out there.
If you're looking to trade Yuanli Chemical GroupLtd, open an account with the lowest-cost platform trusted by professionals, Interactive Brokers.
With clients in over 200 countries and territories, and access to 160 markets, IBKR lets you trade stocks, options, futures, forex, bonds and funds from a single integrated account.
Enjoy no hidden fees, no account minimums, and FX conversion rates as low as 0.03%, far better than what most brokers offer.
Sponsored ContentNew: Manage All Your Stock Portfolios in One Place
We've created the ultimate portfolio companion for stock investors, and it's free.
• Connect an unlimited number of Portfolios and see your total in one currency
• Be alerted to new Warning Signs or Risks via email or mobile
• Track the Fair Value of your stocks
Have feedback on this article? Concerned about the content? Get in touch with us directly. Alternatively, email editorial-team (at) simplywallst.com.
This article by Simply Wall St is general in nature. We provide commentary based on historical data and analyst forecasts only using an unbiased methodology and our articles are not intended to be financial advice. It does not constitute a recommendation to buy or sell any stock, and does not take account of your objectives, or your financial situation. We aim to bring you long-term focused analysis driven by fundamental data. Note that our analysis may not factor in the latest price-sensitive company announcements or qualitative material. Simply Wall St has no position in any stocks mentioned.
About SHSE:603217
Yuanli Chemical GroupLtd
Engages in the research and development, production, and sale of fine chemicals, bio-based products, and new material products.
Excellent balance sheet and slightly overvalued.
Market Insights

Community Narratives

