
Advertisement
Shandong Huapeng Glass Co.,Ltd.'s (SHSE:603021) Popularity With Investors Under Threat As Stock Sinks 29%
Shandong Huapeng Glass Co.,Ltd. (SHSE:603021) shareholders that were waiting for something to happen have been dealt a blow with a 29% share price drop in the last month. For any long-term shareholders, the last month ends a year to forget by locking in a 51% share price decline.
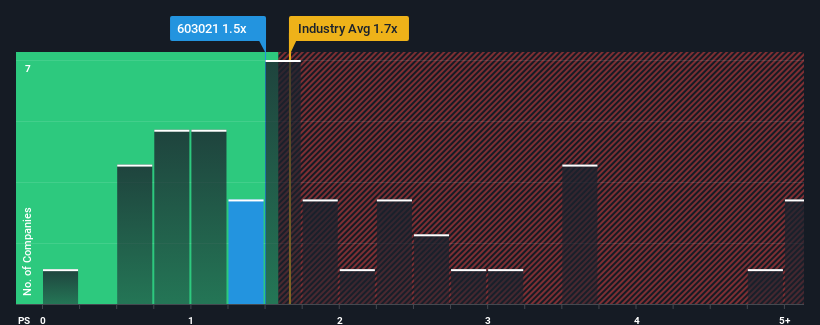
In spite of the heavy fall in price, it's still not a stretch to say that Shandong Huapeng GlassLtd's price-to-sales (or "P/S") ratio of 1.5x right now seems quite "middle-of-the-road" compared to the Packaging industry in China, where the median P/S ratio is around 1.7x. While this might not raise any eyebrows, if the P/S ratio is not justified investors could be missing out on a potential opportunity or ignoring looming disappointment.
View our latest analysis for Shandong Huapeng GlassLtd
What Does Shandong Huapeng GlassLtd's P/S Mean For Shareholders?
As an illustration, revenue has deteriorated at Shandong Huapeng GlassLtd over the last year, which is not ideal at all. It might be that many expect the company to put the disappointing revenue performance behind them over the coming period, which has kept the P/S from falling. If not, then existing shareholders may be a little nervous about the viability of the share price.
Want the full picture on earnings, revenue and cash flow for the company? Then our free report on Shandong Huapeng GlassLtd will help you shine a light on its historical performance.Is There Some Revenue Growth Forecasted For Shandong Huapeng GlassLtd?
In order to justify its P/S ratio, Shandong Huapeng GlassLtd would need to produce growth that's similar to the industry.
Retrospectively, the last year delivered a frustrating 29% decrease to the company's top line. As a result, revenue from three years ago have also fallen 45% overall. Accordingly, shareholders would have felt downbeat about the medium-term rates of revenue growth.
Comparing that to the industry, which is predicted to deliver 22% growth in the next 12 months, the company's downward momentum based on recent medium-term revenue results is a sobering picture.
In light of this, it's somewhat alarming that Shandong Huapeng GlassLtd's P/S sits in line with the majority of other companies. Apparently many investors in the company are way less bearish than recent times would indicate and aren't willing to let go of their stock right now. Only the boldest would assume these prices are sustainable as a continuation of recent revenue trends is likely to weigh on the share price eventually.
What Does Shandong Huapeng GlassLtd's P/S Mean For Investors?
Shandong Huapeng GlassLtd's plummeting stock price has brought its P/S back to a similar region as the rest of the industry. While the price-to-sales ratio shouldn't be the defining factor in whether you buy a stock or not, it's quite a capable barometer of revenue expectations.
Our look at Shandong Huapeng GlassLtd revealed its shrinking revenues over the medium-term haven't impacted the P/S as much as we anticipated, given the industry is set to grow. When we see revenue heading backwards in the context of growing industry forecasts, it'd make sense to expect a possible share price decline on the horizon, sending the moderate P/S lower. If recent medium-term revenue trends continue, it will place shareholders' investments at risk and potential investors in danger of paying an unnecessary premium.
You need to take note of risks, for example - Shandong Huapeng GlassLtd has 2 warning signs (and 1 which doesn't sit too well with us) we think you should know about.
If you're unsure about the strength of Shandong Huapeng GlassLtd's business, why not explore our interactive list of stocks with solid business fundamentals for some other companies you may have missed.
New: Manage All Your Stock Portfolios in One Place
We've created the ultimate portfolio companion for stock investors, and it's free.
• Connect an unlimited number of Portfolios and see your total in one currency
• Be alerted to new Warning Signs or Risks via email or mobile
• Track the Fair Value of your stocks
Have feedback on this article? Concerned about the content? Get in touch with us directly. Alternatively, email editorial-team (at) simplywallst.com.
This article by Simply Wall St is general in nature. We provide commentary based on historical data and analyst forecasts only using an unbiased methodology and our articles are not intended to be financial advice. It does not constitute a recommendation to buy or sell any stock, and does not take account of your objectives, or your financial situation. We aim to bring you long-term focused analysis driven by fundamental data. Note that our analysis may not factor in the latest price-sensitive company announcements or qualitative material. Simply Wall St has no position in any stocks mentioned.
About SHSE:603021
Shandong Huapeng GlassLtd
Researches and develops, produces, and sells various glassware products and glass bottles primarily in China.
Fair value with mediocre balance sheet.
Market Insights

Advertisement
Community Narratives
Groundbreaking therapies that could change the treatment landscape for PTSD, fibromyalgia, MS & Alzheimer’s
Fair Value US$6.20|86.9% undervalued
CM
Community Contributor
DigitalOcean Will Grow 14% by Embracing AI with Paperspace Acquisition
Fair Value US$50.00|41.7% undervalued
NE
Community Contributor
Viant Technology: A Rising AdTech Challenger in the AI-Powered CTV Market
Fair Value US$38.61|63.2% undervalued
BL
Community Contributor
Volvo will Accelerate Forward into Electric and Autonomous Leadership in Five Years
Fair Value SEK 438.80|37.1% undervalued
UN
Community Contributor