- China
- /
- Basic Materials
- /
- SHSE:600678
Sichuan Golden Summit (group) Joint-Stock Co., Ltd.'s (SHSE:600678) 35% Share Price Surge Not Quite Adding Up


Sichuan Golden Summit (group) Joint-Stock Co., Ltd. (SHSE:600678) shares have had a really impressive month, gaining 35% after a shaky period beforehand. The last 30 days bring the annual gain to a very sharp 78%.
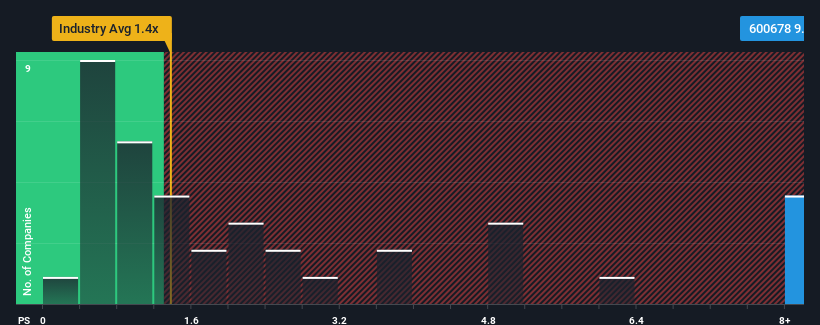
Since its price has surged higher, given around half the companies in China's Basic Materials industry have price-to-sales ratios (or "P/S") below 1.4x, you may consider Sichuan Golden Summit (group) as a stock to avoid entirely with its 9.7x P/S ratio. Nonetheless, we'd need to dig a little deeper to determine if there is a rational basis for the highly elevated P/S.
See our latest analysis for Sichuan Golden Summit (group)
What Does Sichuan Golden Summit (group)'s Recent Performance Look Like?
For example, consider that Sichuan Golden Summit (group)'s financial performance has been poor lately as its revenue has been in decline. Perhaps the market believes the company can do enough to outperform the rest of the industry in the near future, which is keeping the P/S ratio high. However, if this isn't the case, investors might get caught out paying too much for the stock.
Want the full picture on earnings, revenue and cash flow for the company? Then our free report on Sichuan Golden Summit (group) will help you shine a light on its historical performance.What Are Revenue Growth Metrics Telling Us About The High P/S?
In order to justify its P/S ratio, Sichuan Golden Summit (group) would need to produce outstanding growth that's well in excess of the industry.
Taking a look back first, the company's revenue growth last year wasn't something to get excited about as it posted a disappointing decline of 7.1%. As a result, revenue from three years ago have also fallen 12% overall. So unfortunately, we have to acknowledge that the company has not done a great job of growing revenue over that time.
Weighing that medium-term revenue trajectory against the broader industry's one-year forecast for expansion of 11% shows it's an unpleasant look.
In light of this, it's alarming that Sichuan Golden Summit (group)'s P/S sits above the majority of other companies. It seems most investors are ignoring the recent poor growth rate and are hoping for a turnaround in the company's business prospects. There's a very good chance existing shareholders are setting themselves up for future disappointment if the P/S falls to levels more in line with the recent negative growth rates.
What We Can Learn From Sichuan Golden Summit (group)'s P/S?
The strong share price surge has lead to Sichuan Golden Summit (group)'s P/S soaring as well. It's argued the price-to-sales ratio is an inferior measure of value within certain industries, but it can be a powerful business sentiment indicator.
We've established that Sichuan Golden Summit (group) currently trades on a much higher than expected P/S since its recent revenues have been in decline over the medium-term. Right now we aren't comfortable with the high P/S as this revenue performance is highly unlikely to support such positive sentiment for long. If recent medium-term revenue trends continue, it will place shareholders' investments at significant risk and potential investors in danger of paying an excessive premium.
And what about other risks? Every company has them, and we've spotted 2 warning signs for Sichuan Golden Summit (group) you should know about.
Of course, profitable companies with a history of great earnings growth are generally safer bets. So you may wish to see this free collection of other companies that have reasonable P/E ratios and have grown earnings strongly.
New: Manage All Your Stock Portfolios in One Place
We've created the ultimate portfolio companion for stock investors, and it's free.
• Connect an unlimited number of Portfolios and see your total in one currency
• Be alerted to new Warning Signs or Risks via email or mobile
• Track the Fair Value of your stocks
Have feedback on this article? Concerned about the content? Get in touch with us directly. Alternatively, email editorial-team (at) simplywallst.com.
This article by Simply Wall St is general in nature. We provide commentary based on historical data and analyst forecasts only using an unbiased methodology and our articles are not intended to be financial advice. It does not constitute a recommendation to buy or sell any stock, and does not take account of your objectives, or your financial situation. We aim to bring you long-term focused analysis driven by fundamental data. Note that our analysis may not factor in the latest price-sensitive company announcements or qualitative material. Simply Wall St has no position in any stocks mentioned.
About SHSE:600678
Sichuan Golden Summit (group)
Sichuan Golden Summit (group) Joint-Stock Co., Ltd.
Low with worrying balance sheet.
Market Insights

Community Narratives

