Zhejiang Xinan Chemical Industrial Group Co.,Ltd's (SHSE:600596) Share Price Is Matching Sentiment Around Its Revenues


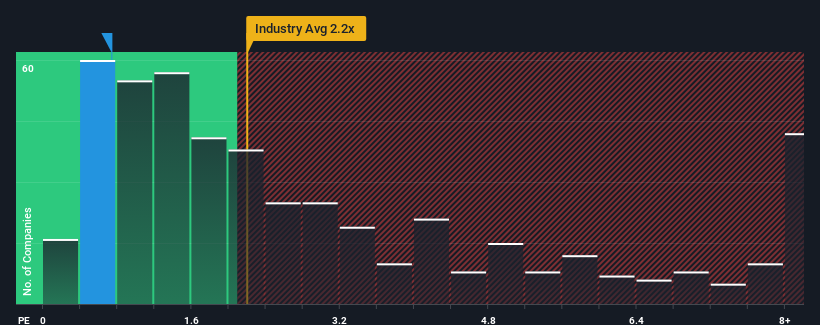
With a price-to-sales (or "P/S") ratio of 0.7x Zhejiang Xinan Chemical Industrial Group Co.,Ltd (SHSE:600596) may be sending bullish signals at the moment, given that almost half of all the Chemicals companies in China have P/S ratios greater than 2.2x and even P/S higher than 5x are not unusual. Nonetheless, we'd need to dig a little deeper to determine if there is a rational basis for the reduced P/S.
View our latest analysis for Zhejiang Xinan Chemical Industrial GroupLtd
What Does Zhejiang Xinan Chemical Industrial GroupLtd's P/S Mean For Shareholders?
Zhejiang Xinan Chemical Industrial GroupLtd could be doing better as its revenue has been going backwards lately while most other companies have been seeing positive revenue growth. Perhaps the P/S remains low as investors think the prospects of strong revenue growth aren't on the horizon. If you still like the company, you'd be hoping this isn't the case so that you could potentially pick up some stock while it's out of favour.
Want the full picture on analyst estimates for the company? Then our free report on Zhejiang Xinan Chemical Industrial GroupLtd will help you uncover what's on the horizon.What Are Revenue Growth Metrics Telling Us About The Low P/S?
Zhejiang Xinan Chemical Industrial GroupLtd's P/S ratio would be typical for a company that's only expected to deliver limited growth, and importantly, perform worse than the industry.
Retrospectively, the last year delivered a frustrating 33% decrease to the company's top line. That put a dampener on the good run it was having over the longer-term as its three-year revenue growth is still a noteworthy 25% in total. So we can start by confirming that the company has generally done a good job of growing revenue over that time, even though it had some hiccups along the way.
Looking ahead now, revenue is anticipated to climb by 14% during the coming year according to the one analyst following the company. That's shaping up to be materially lower than the 21% growth forecast for the broader industry.
In light of this, it's understandable that Zhejiang Xinan Chemical Industrial GroupLtd's P/S sits below the majority of other companies. It seems most investors are expecting to see limited future growth and are only willing to pay a reduced amount for the stock.
What We Can Learn From Zhejiang Xinan Chemical Industrial GroupLtd's P/S?
Typically, we'd caution against reading too much into price-to-sales ratios when settling on investment decisions, though it can reveal plenty about what other market participants think about the company.
As we suspected, our examination of Zhejiang Xinan Chemical Industrial GroupLtd's analyst forecasts revealed that its inferior revenue outlook is contributing to its low P/S. Shareholders' pessimism on the revenue prospects for the company seems to be the main contributor to the depressed P/S. The company will need a change of fortune to justify the P/S rising higher in the future.
It's always necessary to consider the ever-present spectre of investment risk. We've identified 3 warning signs with Zhejiang Xinan Chemical Industrial GroupLtd (at least 1 which is concerning), and understanding these should be part of your investment process.
It's important to make sure you look for a great company, not just the first idea you come across. So if growing profitability aligns with your idea of a great company, take a peek at this free list of interesting companies with strong recent earnings growth (and a low P/E).
If you're looking to trade Zhejiang Xinan Chemical Industrial GroupLtd, open an account with the lowest-cost platform trusted by professionals, Interactive Brokers.
With clients in over 200 countries and territories, and access to 160 markets, IBKR lets you trade stocks, options, futures, forex, bonds and funds from a single integrated account.
Enjoy no hidden fees, no account minimums, and FX conversion rates as low as 0.03%, far better than what most brokers offer.
Sponsored ContentValuation is complex, but we're here to simplify it.
Discover if Zhejiang Xinan Chemical Industrial GroupLtd might be undervalued or overvalued with our detailed analysis, featuring fair value estimates, potential risks, dividends, insider trades, and its financial condition.
Access Free AnalysisHave feedback on this article? Concerned about the content? Get in touch with us directly. Alternatively, email editorial-team (at) simplywallst.com.
This article by Simply Wall St is general in nature. We provide commentary based on historical data and analyst forecasts only using an unbiased methodology and our articles are not intended to be financial advice. It does not constitute a recommendation to buy or sell any stock, and does not take account of your objectives, or your financial situation. We aim to bring you long-term focused analysis driven by fundamental data. Note that our analysis may not factor in the latest price-sensitive company announcements or qualitative material. Simply Wall St has no position in any stocks mentioned.
About SHSE:600596
Zhejiang Xinan Chemical Industrial GroupLtd
Develops, manufactures, and sells chemical products for plant protection in China and internationally.
Adequate balance sheet with moderate growth potential.
Similar Companies
Market Insights

Community Narratives

