
Advertisement
- China
- /
- Basic Materials
- /
- SHSE:600586
Shandong Jinjing Science & Technology StockLtd (SHSE:600586) shareholders are still up 124% over 5 years despite pulling back 6.1% in the past week
The most you can lose on any stock (assuming you don't use leverage) is 100% of your money. But when you pick a company that is really flourishing, you can make more than 100%. Long term Shandong Jinjing Science & Technology Stock Co.,Ltd (SHSE:600586) shareholders would be well aware of this, since the stock is up 109% in five years. It's also good to see the share price up 20% over the last quarter. But this could be related to the strong market, which is up 31% in the last three months.
In light of the stock dropping 6.1% in the past week, we want to investigate the longer term story, and see if fundamentals have been the driver of the company's positive five-year return.
Check out our latest analysis for Shandong Jinjing Science & Technology StockLtd
In his essay The Superinvestors of Graham-and-Doddsville Warren Buffett described how share prices do not always rationally reflect the value of a business. One flawed but reasonable way to assess how sentiment around a company has changed is to compare the earnings per share (EPS) with the share price.
During the five years of share price growth, Shandong Jinjing Science & Technology StockLtd moved from a loss to profitability. That kind of transition can be an inflection point that justifies a strong share price gain, just as we have seen here.
You can see below how EPS has changed over time (discover the exact values by clicking on the image).
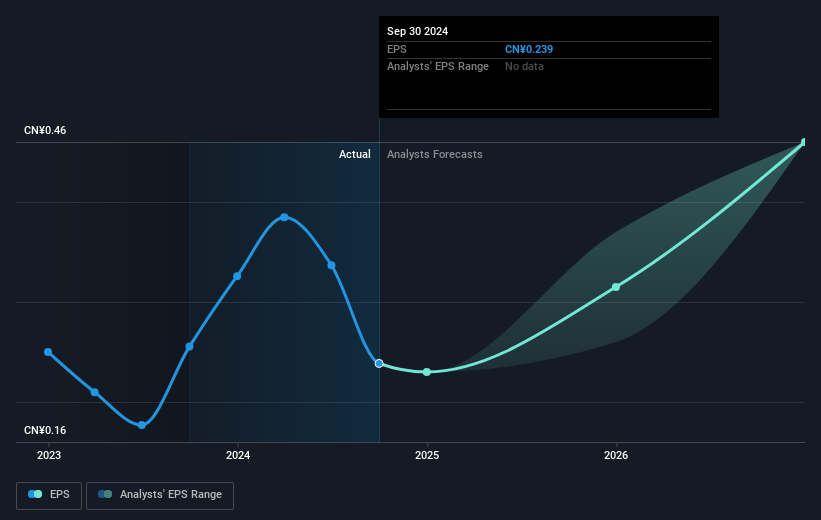
This free interactive report on Shandong Jinjing Science & Technology StockLtd's earnings, revenue and cash flow is a great place to start, if you want to investigate the stock further.
What About Dividends?
As well as measuring the share price return, investors should also consider the total shareholder return (TSR). The TSR incorporates the value of any spin-offs or discounted capital raisings, along with any dividends, based on the assumption that the dividends are reinvested. Arguably, the TSR gives a more comprehensive picture of the return generated by a stock. In the case of Shandong Jinjing Science & Technology StockLtd, it has a TSR of 124% for the last 5 years. That exceeds its share price return that we previously mentioned. The dividends paid by the company have thusly boosted the total shareholder return.
A Different Perspective
While the broader market gained around 13% in the last year, Shandong Jinjing Science & Technology StockLtd shareholders lost 6.8% (even including dividends). Even the share prices of good stocks drop sometimes, but we want to see improvements in the fundamental metrics of a business, before getting too interested. On the bright side, long term shareholders have made money, with a gain of 17% per year over half a decade. If the fundamental data continues to indicate long term sustainable growth, the current sell-off could be an opportunity worth considering. It's always interesting to track share price performance over the longer term. But to understand Shandong Jinjing Science & Technology StockLtd better, we need to consider many other factors. Case in point: We've spotted 2 warning signs for Shandong Jinjing Science & Technology StockLtd you should be aware of.
Of course, you might find a fantastic investment by looking elsewhere. So take a peek at this free list of companies we expect will grow earnings.
Please note, the market returns quoted in this article reflect the market weighted average returns of stocks that currently trade on Chinese exchanges.
New: Manage All Your Stock Portfolios in One Place
We've created the ultimate portfolio companion for stock investors, and it's free.
• Connect an unlimited number of Portfolios and see your total in one currency
• Be alerted to new Warning Signs or Risks via email or mobile
• Track the Fair Value of your stocks
Have feedback on this article? Concerned about the content? Get in touch with us directly. Alternatively, email editorial-team (at) simplywallst.com.
This article by Simply Wall St is general in nature. We provide commentary based on historical data and analyst forecasts only using an unbiased methodology and our articles are not intended to be financial advice. It does not constitute a recommendation to buy or sell any stock, and does not take account of your objectives, or your financial situation. We aim to bring you long-term focused analysis driven by fundamental data. Note that our analysis may not factor in the latest price-sensitive company announcements or qualitative material. Simply Wall St has no position in any stocks mentioned.
About SHSE:600586
Shandong Jinjing Science & Technology StockLtd
Engages in the manufacture and sale of glass and glass products.
Moderate growth potential and slightly overvalued.
Market Insights


Advertisement
Community Narratives
For the Emperor: Why Games Workshop Could Be a Star Investment
Fair Value UK£160.00|0.4% overvalued
RO
Community Contributor
Securitas will boost margins with AI and tech-driven services
Fair Value SEK 260.91|44.5% undervalued
UN
Community Contributor
A Leader in EV Charging with Growth Potential
Fair Value €27.00|17.8% undervalued
TI
Community Contributor