
Advertisement
- China
- /
- Metals and Mining
- /
- SHSE:600489
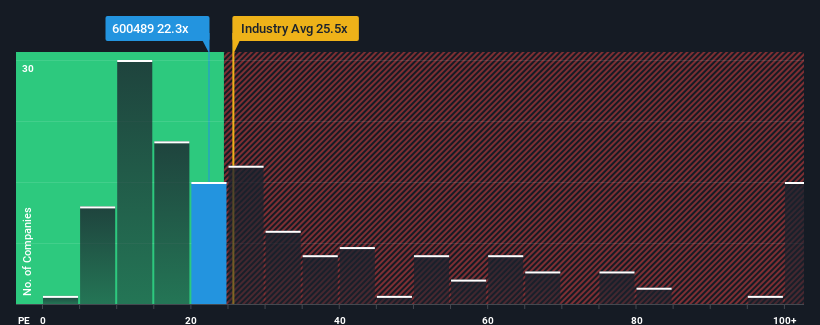
Investors Don't See Light At End Of Zhongjin Gold Corp.,Ltd's (SHSE:600489) Tunnel

When close to half the companies in China have price-to-earnings ratios (or "P/E's") above 29x, you may consider Zhongjin Gold Corp.,Ltd (SHSE:600489) as an attractive investment with its 22.3x P/E ratio. Although, it's not wise to just take the P/E at face value as there may be an explanation why it's limited.
With earnings growth that's superior to most other companies of late, Zhongjin GoldLtd has been doing relatively well. It might be that many expect the strong earnings performance to degrade substantially, which has repressed the P/E. If you like the company, you'd be hoping this isn't the case so that you could potentially pick up some stock while it's out of favour.
View our latest analysis for Zhongjin GoldLtd
What Are Growth Metrics Telling Us About The Low P/E?
In order to justify its P/E ratio, Zhongjin GoldLtd would need to produce sluggish growth that's trailing the market.
Taking a look back first, we see that the company grew earnings per share by an impressive 65% last year. Pleasingly, EPS has also lifted 69% in aggregate from three years ago, thanks to the last 12 months of growth. So we can start by confirming that the company has done a great job of growing earnings over that time.
Turning to the outlook, the next three years should generate growth of 14% each year as estimated by the six analysts watching the company. With the market predicted to deliver 25% growth per annum, the company is positioned for a weaker earnings result.
With this information, we can see why Zhongjin GoldLtd is trading at a P/E lower than the market. It seems most investors are expecting to see limited future growth and are only willing to pay a reduced amount for the stock.
The Key Takeaway
We'd say the price-to-earnings ratio's power isn't primarily as a valuation instrument but rather to gauge current investor sentiment and future expectations.
We've established that Zhongjin GoldLtd maintains its low P/E on the weakness of its forecast growth being lower than the wider market, as expected. At this stage investors feel the potential for an improvement in earnings isn't great enough to justify a higher P/E ratio. It's hard to see the share price rising strongly in the near future under these circumstances.
You always need to take note of risks, for example - Zhongjin GoldLtd has 1 warning sign we think you should be aware of.
Of course, you might also be able to find a better stock than Zhongjin GoldLtd. So you may wish to see this free collection of other companies that have reasonable P/E ratios and have grown earnings strongly.
Valuation is complex, but we're here to simplify it.
Discover if Zhongjin GoldLtd might be undervalued or overvalued with our detailed analysis, featuring fair value estimates, potential risks, dividends, insider trades, and its financial condition.
Access Free AnalysisHave feedback on this article? Concerned about the content? Get in touch with us directly. Alternatively, email editorial-team (at) simplywallst.com.
This article by Simply Wall St is general in nature. We provide commentary based on historical data and analyst forecasts only using an unbiased methodology and our articles are not intended to be financial advice. It does not constitute a recommendation to buy or sell any stock, and does not take account of your objectives, or your financial situation. We aim to bring you long-term focused analysis driven by fundamental data. Note that our analysis may not factor in the latest price-sensitive company announcements or qualitative material. Simply Wall St has no position in any stocks mentioned.
Have feedback on this article? Concerned about the content? Get in touch with us directly. Alternatively, email editorial-team@simplywallst.com
About SHSE:600489
Zhongjin GoldLtd
Engages in the mining, smelting, and sale of non-ferrous metals in China.
Flawless balance sheet, undervalued and pays a dividend.
Market Insights

Advertisement
Community Narratives
WhiteCap Is Positioned To Profit Regardless Of Trump's Policy 
Fair Value CA$22.60|61.6% undervalued
ST
Equity Analyst and Writer
Microsoft's Evolution Will Drive Revenue to New Heights Fueled by AI
Fair Value US$360.00|29.9% overvalued
BR
Community Contributor
A CASE FOR USD$2.50 (CAD$3.44) BY 2028 (A 5-10 BAGGER)
Fair Value CA$3.44|87.8% undervalued
AG
Community Contributor