Revenues Working Against Anhui Liuguo Chemical Co., Ltd.'s (SHSE:600470) Share Price Following 25% Dive


Anhui Liuguo Chemical Co., Ltd. (SHSE:600470) shares have had a horrible month, losing 25% after a relatively good period beforehand. The drop over the last 30 days has capped off a tough year for shareholders, with the share price down 25% in that time.
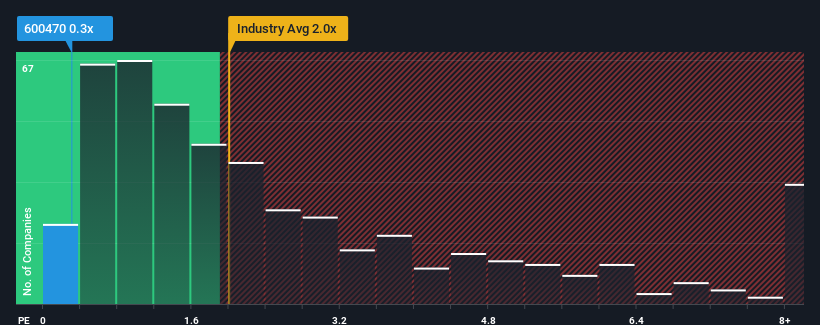
In spite of the heavy fall in price, Anhui Liuguo Chemical's price-to-sales (or "P/S") ratio of 0.3x might still make it look like a buy right now compared to the Chemicals industry in China, where around half of the companies have P/S ratios above 2x and even P/S above 4x are quite common. Although, it's not wise to just take the P/S at face value as there may be an explanation why it's limited.
View our latest analysis for Anhui Liuguo Chemical
How Anhui Liuguo Chemical Has Been Performing
For example, consider that Anhui Liuguo Chemical's financial performance has been poor lately as its revenue has been in decline. Perhaps the market believes the recent revenue performance isn't good enough to keep up the industry, causing the P/S ratio to suffer. If you like the company, you'd be hoping this isn't the case so that you could potentially pick up some stock while it's out of favour.
Although there are no analyst estimates available for Anhui Liuguo Chemical, take a look at this free data-rich visualisation to see how the company stacks up on earnings, revenue and cash flow.Is There Any Revenue Growth Forecasted For Anhui Liuguo Chemical?
In order to justify its P/S ratio, Anhui Liuguo Chemical would need to produce sluggish growth that's trailing the industry.
Retrospectively, the last year delivered a frustrating 11% decrease to the company's top line. This has soured the latest three-year period, which nevertheless managed to deliver a decent 30% overall rise in revenue. Although it's been a bumpy ride, it's still fair to say the revenue growth recently has been mostly respectable for the company.
Comparing the recent medium-term revenue trends against the industry's one-year growth forecast of 23% shows it's noticeably less attractive.
In light of this, it's understandable that Anhui Liuguo Chemical's P/S sits below the majority of other companies. Apparently many shareholders weren't comfortable holding on to something they believe will continue to trail the wider industry.
What We Can Learn From Anhui Liuguo Chemical's P/S?
Anhui Liuguo Chemical's recently weak share price has pulled its P/S back below other Chemicals companies. We'd say the price-to-sales ratio's power isn't primarily as a valuation instrument but rather to gauge current investor sentiment and future expectations.
Our examination of Anhui Liuguo Chemical confirms that the company's revenue trends over the past three-year years are a key factor in its low price-to-sales ratio, as we suspected, given they fall short of current industry expectations. At this stage investors feel the potential for an improvement in revenue isn't great enough to justify a higher P/S ratio. If recent medium-term revenue trends continue, it's hard to see the share price experience a reversal of fortunes anytime soon.
It's always necessary to consider the ever-present spectre of investment risk. We've identified 3 warning signs with Anhui Liuguo Chemical (at least 1 which is potentially serious), and understanding these should be part of your investment process.
It's important to make sure you look for a great company, not just the first idea you come across. So if growing profitability aligns with your idea of a great company, take a peek at this free list of interesting companies with strong recent earnings growth (and a low P/E).
New: Manage All Your Stock Portfolios in One Place
We've created the ultimate portfolio companion for stock investors, and it's free.
• Connect an unlimited number of Portfolios and see your total in one currency
• Be alerted to new Warning Signs or Risks via email or mobile
• Track the Fair Value of your stocks
Have feedback on this article? Concerned about the content? Get in touch with us directly. Alternatively, email editorial-team (at) simplywallst.com.
This article by Simply Wall St is general in nature. We provide commentary based on historical data and analyst forecasts only using an unbiased methodology and our articles are not intended to be financial advice. It does not constitute a recommendation to buy or sell any stock, and does not take account of your objectives, or your financial situation. We aim to bring you long-term focused analysis driven by fundamental data. Note that our analysis may not factor in the latest price-sensitive company announcements or qualitative material. Simply Wall St has no position in any stocks mentioned.
About SHSE:600470
Anhui Liuguo Chemical
Produces, processes, and sells fertilizers in China.
Excellent balance sheet and fair value.
Market Insights

Community Narratives


