
Advertisement
- China
- /
- Metals and Mining
- /
- SHSE:600459
An Intrinsic Calculation For Sino-Platinum Metals Co.,Ltd (SHSE:600459) Suggests It's 29% Undervalued
Key Insights
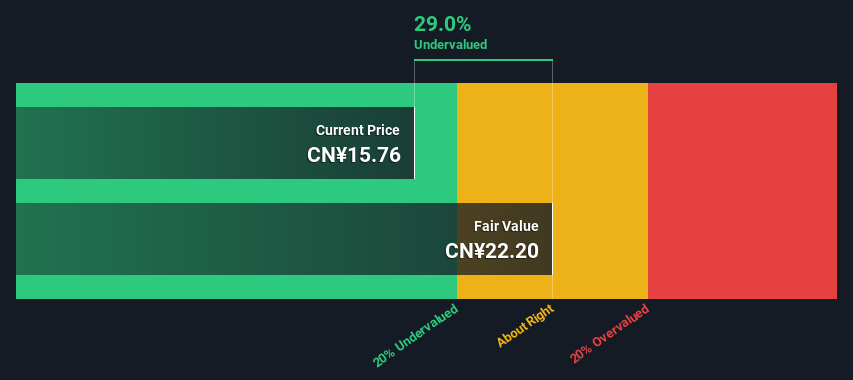
- Using the 2 Stage Free Cash Flow to Equity, Sino-Platinum MetalsLtd fair value estimate is CN¥22.20
- Sino-Platinum MetalsLtd is estimated to be 29% undervalued based on current share price of CN¥15.76
- Sino-Platinum MetalsLtd's peers are currently trading at a premium of 205% on average
Today we will run through one way of estimating the intrinsic value of Sino-Platinum Metals Co.,Ltd (SHSE:600459) by projecting its future cash flows and then discounting them to today's value. We will take advantage of the Discounted Cash Flow (DCF) model for this purpose. Don't get put off by the jargon, the math behind it is actually quite straightforward.
We would caution that there are many ways of valuing a company and, like the DCF, each technique has advantages and disadvantages in certain scenarios. For those who are keen learners of equity analysis, the Simply Wall St analysis model here may be something of interest to you.
Check out our latest analysis for Sino-Platinum MetalsLtd
The Calculation
We use what is known as a 2-stage model, which simply means we have two different periods of growth rates for the company's cash flows. Generally the first stage is higher growth, and the second stage is a lower growth phase. To begin with, we have to get estimates of the next ten years of cash flows. Seeing as no analyst estimates of free cash flow are available to us, we have extrapolate the previous free cash flow (FCF) from the company's last reported value. We assume companies with shrinking free cash flow will slow their rate of shrinkage, and that companies with growing free cash flow will see their growth rate slow, over this period. We do this to reflect that growth tends to slow more in the early years than it does in later years.
Generally we assume that a dollar today is more valuable than a dollar in the future, so we discount the value of these future cash flows to their estimated value in today's dollars:
10-year free cash flow (FCF) forecast
| 2024 | 2025 | 2026 | 2027 | 2028 | 2029 | 2030 | 2031 | 2032 | 2033 | |
| Levered FCF (CN¥, Millions) | CN¥1.13b | CN¥1.18b | CN¥1.23b | CN¥1.27b | CN¥1.32b | CN¥1.36b | CN¥1.41b | CN¥1.45b | CN¥1.50b | CN¥1.54b |
| Growth Rate Estimate Source | Est @ 5.39% | Est @ 4.65% | Est @ 4.14% | Est @ 3.78% | Est @ 3.53% | Est @ 3.35% | Est @ 3.23% | Est @ 3.14% | Est @ 3.08% | Est @ 3.04% |
| Present Value (CN¥, Millions) Discounted @ 9.9% | CN¥1.0k | CN¥976 | CN¥924 | CN¥873 | CN¥822 | CN¥773 | CN¥726 | CN¥682 | CN¥639 | CN¥599 |
("Est" = FCF growth rate estimated by Simply Wall St)
Present Value of 10-year Cash Flow (PVCF) = CN¥8.0b
The second stage is also known as Terminal Value, this is the business's cash flow after the first stage. For a number of reasons a very conservative growth rate is used that cannot exceed that of a country's GDP growth. In this case we have used the 5-year average of the 10-year government bond yield (2.9%) to estimate future growth. In the same way as with the 10-year 'growth' period, we discount future cash flows to today's value, using a cost of equity of 9.9%.
Terminal Value (TV)= FCF2033 × (1 + g) ÷ (r – g) = CN¥1.5b× (1 + 2.9%) ÷ (9.9%– 2.9%) = CN¥23b
Present Value of Terminal Value (PVTV)= TV / (1 + r)10= CN¥23b÷ ( 1 + 9.9%)10= CN¥8.9b
The total value is the sum of cash flows for the next ten years plus the discounted terminal value, which results in the Total Equity Value, which in this case is CN¥17b. The last step is to then divide the equity value by the number of shares outstanding. Compared to the current share price of CN¥15.8, the company appears a touch undervalued at a 29% discount to where the stock price trades currently. The assumptions in any calculation have a big impact on the valuation, so it is better to view this as a rough estimate, not precise down to the last cent.
The Assumptions
Now the most important inputs to a discounted cash flow are the discount rate, and of course, the actual cash flows. You don't have to agree with these inputs, I recommend redoing the calculations yourself and playing with them. The DCF also does not consider the possible cyclicality of an industry, or a company's future capital requirements, so it does not give a full picture of a company's potential performance. Given that we are looking at Sino-Platinum MetalsLtd as potential shareholders, the cost of equity is used as the discount rate, rather than the cost of capital (or weighted average cost of capital, WACC) which accounts for debt. In this calculation we've used 9.9%, which is based on a levered beta of 1.237. Beta is a measure of a stock's volatility, compared to the market as a whole. We get our beta from the industry average beta of globally comparable companies, with an imposed limit between 0.8 and 2.0, which is a reasonable range for a stable business.
SWOT Analysis for Sino-Platinum MetalsLtd
Strength
- Earnings growth over the past year exceeded the industry.
- Debt is not viewed as a risk.
- Dividends are covered by earnings and cash flows.
Weakness
- Dividend is low compared to the top 25% of dividend payers in the Metals and Mining market.
Opportunity
- Annual revenue is forecast to grow faster than the Chinese market.
- Trading below our estimate of fair value by more than 20%.
Threat
- No apparent threats visible for 600459.
Next Steps:
Valuation is only one side of the coin in terms of building your investment thesis, and it is only one of many factors that you need to assess for a company. DCF models are not the be-all and end-all of investment valuation. Instead the best use for a DCF model is to test certain assumptions and theories to see if they would lead to the company being undervalued or overvalued. If a company grows at a different rate, or if its cost of equity or risk free rate changes sharply, the output can look very different. What is the reason for the share price sitting below the intrinsic value? For Sino-Platinum MetalsLtd, we've compiled three important items you should explore:
- Risks: You should be aware of the 1 warning sign for Sino-Platinum MetalsLtd we've uncovered before considering an investment in the company.
- Future Earnings: How does 600459's growth rate compare to its peers and the wider market? Dig deeper into the analyst consensus number for the upcoming years by interacting with our free analyst growth expectation chart.
- Other Solid Businesses: Low debt, high returns on equity and good past performance are fundamental to a strong business. Why not explore our interactive list of stocks with solid business fundamentals to see if there are other companies you may not have considered!
PS. The Simply Wall St app conducts a discounted cash flow valuation for every stock on the SHSE every day. If you want to find the calculation for other stocks just search here.
New: Manage All Your Stock Portfolios in One Place
We've created the ultimate portfolio companion for stock investors, and it's free.
• Connect an unlimited number of Portfolios and see your total in one currency
• Be alerted to new Warning Signs or Risks via email or mobile
• Track the Fair Value of your stocks
Have feedback on this article? Concerned about the content? Get in touch with us directly. Alternatively, email editorial-team (at) simplywallst.com.
This article by Simply Wall St is general in nature. We provide commentary based on historical data and analyst forecasts only using an unbiased methodology and our articles are not intended to be financial advice. It does not constitute a recommendation to buy or sell any stock, and does not take account of your objectives, or your financial situation. We aim to bring you long-term focused analysis driven by fundamental data. Note that our analysis may not factor in the latest price-sensitive company announcements or qualitative material. Simply Wall St has no position in any stocks mentioned.
About SHSE:600459
Sino-Platinum MetalsLtd
Engages in the research, development, production, sales, and technical services of metal and non-metal materials in China.
Flawless balance sheet with solid track record and pays a dividend.
Market Insights

Advertisement
Community Narratives

BMW cruising ahead with new EVs and premium models to boost revenue 5%
Fair Value €135.07|45.0% undervalued
UN
Community Contributor
EU#2 - From Humble Beginnings to Global Powerhouse
Fair Value DKK 851.04|47.8% undervalued
TO
Community Contributor