Results: Hengli Petrochemical Co.,Ltd. Beat Earnings Expectations And Analysts Now Have New Forecasts


As you might know, Hengli Petrochemical Co.,Ltd. (SHSE:600346) recently reported its first-quarter numbers. Results look mixed - while revenue fell marginally short of analyst estimates at CN¥58b, statutory earnings beat expectations 5.6%, with Hengli PetrochemicalLtd reporting profits of CN¥0.30 per share. Earnings are an important time for investors, as they can track a company's performance, look at what the analysts are forecasting for next year, and see if there's been a change in sentiment towards the company. We've gathered the most recent statutory forecasts to see whether the analysts have changed their earnings models, following these results.
See our latest analysis for Hengli PetrochemicalLtd
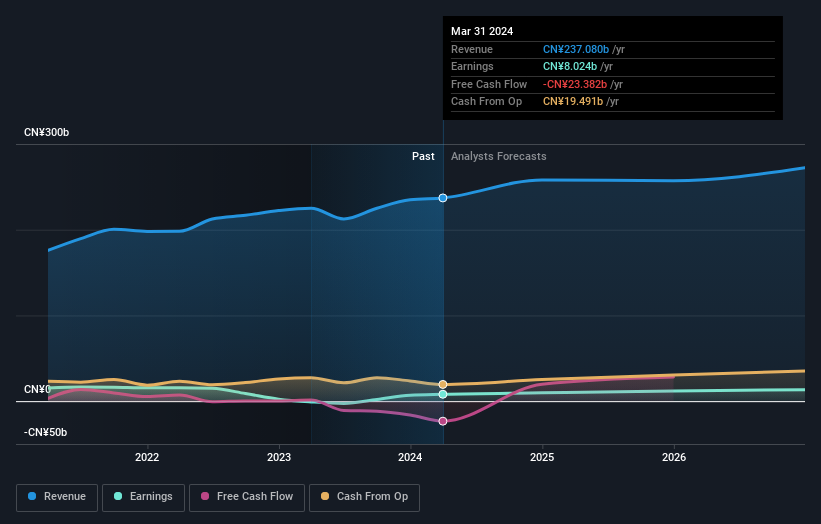
After the latest results, the 15 analysts covering Hengli PetrochemicalLtd are now predicting revenues of CN¥258.1b in 2024. If met, this would reflect a solid 8.9% improvement in revenue compared to the last 12 months. Per-share earnings are expected to soar 22% to CN¥1.39. Before this earnings report, the analysts had been forecasting revenues of CN¥250.6b and earnings per share (EPS) of CN¥1.46 in 2024. Overall it looks as though the analysts were a bit mixed on the latest results. Although there was a a solid to revenue, the consensus also made a small dip in its earnings per share forecasts.
There's been no major changes to the price target of CN¥17.76, suggesting that the impact of higher forecast revenue and lower earnings won't result in a meaningful change to the business' valuation. That's not the only conclusion we can draw from this data however, as some investors also like to consider the spread in estimates when evaluating analyst price targets. Currently, the most bullish analyst values Hengli PetrochemicalLtd at CN¥21.80 per share, while the most bearish prices it at CN¥12.80. Analysts definitely have varying views on the business, but the spread of estimates is not wide enough in our view to suggest that extreme outcomes could await Hengli PetrochemicalLtd shareholders.
Taking a look at the bigger picture now, one of the ways we can understand these forecasts is to see how they compare to both past performance and industry growth estimates. We would highlight that Hengli PetrochemicalLtd's revenue growth is expected to slow, with the forecast 12% annualised growth rate until the end of 2024 being well below the historical 20% p.a. growth over the last five years. Compare this against other companies (with analyst forecasts) in the industry, which are in aggregate expected to see revenue growth of 16% annually. So it's pretty clear that, while revenue growth is expected to slow down, the wider industry is also expected to grow faster than Hengli PetrochemicalLtd.
The Bottom Line
The most important thing to take away is that the analysts downgraded their earnings per share estimates, showing that there has been a clear decline in sentiment following these results. Fortunately, they also upgraded their revenue estimates, although our data indicates it is expected to perform worse than the wider industry. There was no real change to the consensus price target, suggesting that the intrinsic value of the business has not undergone any major changes with the latest estimates.
With that in mind, we wouldn't be too quick to come to a conclusion on Hengli PetrochemicalLtd. Long-term earnings power is much more important than next year's profits. At Simply Wall St, we have a full range of analyst estimates for Hengli PetrochemicalLtd going out to 2026, and you can see them free on our platform here..
However, before you get too enthused, we've discovered 2 warning signs for Hengli PetrochemicalLtd (1 is concerning!) that you should be aware of.
Valuation is complex, but we're here to simplify it.
Discover if Hengli PetrochemicalLtd might be undervalued or overvalued with our detailed analysis, featuring fair value estimates, potential risks, dividends, insider trades, and its financial condition.
Access Free AnalysisHave feedback on this article? Concerned about the content? Get in touch with us directly. Alternatively, email editorial-team (at) simplywallst.com.
This article by Simply Wall St is general in nature. We provide commentary based on historical data and analyst forecasts only using an unbiased methodology and our articles are not intended to be financial advice. It does not constitute a recommendation to buy or sell any stock, and does not take account of your objectives, or your financial situation. We aim to bring you long-term focused analysis driven by fundamental data. Note that our analysis may not factor in the latest price-sensitive company announcements or qualitative material. Simply Wall St has no position in any stocks mentioned.
About SHSE:600346
Hengli PetrochemicalLtd
Engages in petrochemical industry in China and internationally.
Undervalued with proven track record.
Market Insights

Community Narratives


