- China
- /
- Metals and Mining
- /
- SHSE:600281
More Unpleasant Surprises Could Be In Store For Shanxi Huayang New Material Co.,Ltd.'s (SHSE:600281) Shares After Tumbling 27%


Shanxi Huayang New Material Co.,Ltd. (SHSE:600281) shares have had a horrible month, losing 27% after a relatively good period beforehand. Instead of being rewarded, shareholders who have already held through the last twelve months are now sitting on a 24% share price drop.
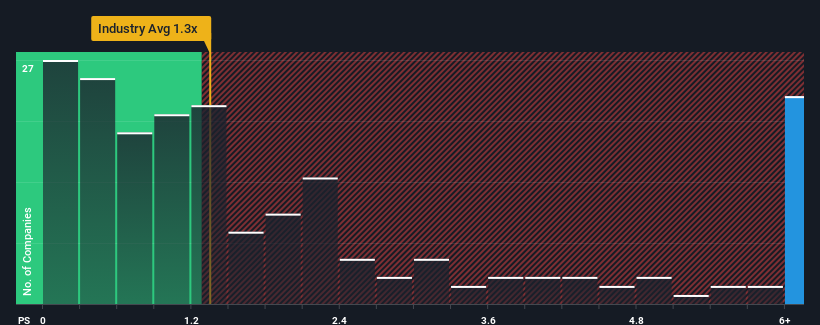
In spite of the heavy fall in price, when almost half of the companies in China's Metals and Mining industry have price-to-sales ratios (or "P/S") below 1.3x, you may still consider Shanxi Huayang New MaterialLtd as a stock not worth researching with its 7.4x P/S ratio. Nonetheless, we'd need to dig a little deeper to determine if there is a rational basis for the highly elevated P/S.
See our latest analysis for Shanxi Huayang New MaterialLtd
What Does Shanxi Huayang New MaterialLtd's Recent Performance Look Like?
For instance, Shanxi Huayang New MaterialLtd's receding revenue in recent times would have to be some food for thought. Perhaps the market believes the company can do enough to outperform the rest of the industry in the near future, which is keeping the P/S ratio high. If not, then existing shareholders may be quite nervous about the viability of the share price.
Although there are no analyst estimates available for Shanxi Huayang New MaterialLtd, take a look at this free data-rich visualisation to see how the company stacks up on earnings, revenue and cash flow.Do Revenue Forecasts Match The High P/S Ratio?
In order to justify its P/S ratio, Shanxi Huayang New MaterialLtd would need to produce outstanding growth that's well in excess of the industry.
Taking a look back first, the company's revenue growth last year wasn't something to get excited about as it posted a disappointing decline of 29%. As a result, revenue from three years ago have also fallen 13% overall. Therefore, it's fair to say the revenue growth recently has been undesirable for the company.
Comparing that to the industry, which is predicted to deliver 15% growth in the next 12 months, the company's downward momentum based on recent medium-term revenue results is a sobering picture.
With this information, we find it concerning that Shanxi Huayang New MaterialLtd is trading at a P/S higher than the industry. It seems most investors are ignoring the recent poor growth rate and are hoping for a turnaround in the company's business prospects. There's a very good chance existing shareholders are setting themselves up for future disappointment if the P/S falls to levels more in line with the recent negative growth rates.
What Does Shanxi Huayang New MaterialLtd's P/S Mean For Investors?
Even after such a strong price drop, Shanxi Huayang New MaterialLtd's P/S still exceeds the industry median significantly. Typically, we'd caution against reading too much into price-to-sales ratios when settling on investment decisions, though it can reveal plenty about what other market participants think about the company.
We've established that Shanxi Huayang New MaterialLtd currently trades on a much higher than expected P/S since its recent revenues have been in decline over the medium-term. With a revenue decline on investors' minds, the likelihood of a souring sentiment is quite high which could send the P/S back in line with what we'd expect. Unless the the circumstances surrounding the recent medium-term improve, it wouldn't be wrong to expect a a difficult period ahead for the company's shareholders.
It is also worth noting that we have found 3 warning signs for Shanxi Huayang New MaterialLtd that you need to take into consideration.
If you're unsure about the strength of Shanxi Huayang New MaterialLtd's business, why not explore our interactive list of stocks with solid business fundamentals for some other companies you may have missed.
New: Manage All Your Stock Portfolios in One Place
We've created the ultimate portfolio companion for stock investors, and it's free.
• Connect an unlimited number of Portfolios and see your total in one currency
• Be alerted to new Warning Signs or Risks via email or mobile
• Track the Fair Value of your stocks
Have feedback on this article? Concerned about the content? Get in touch with us directly. Alternatively, email editorial-team (at) simplywallst.com.
This article by Simply Wall St is general in nature. We provide commentary based on historical data and analyst forecasts only using an unbiased methodology and our articles are not intended to be financial advice. It does not constitute a recommendation to buy or sell any stock, and does not take account of your objectives, or your financial situation. We aim to bring you long-term focused analysis driven by fundamental data. Note that our analysis may not factor in the latest price-sensitive company announcements or qualitative material. Simply Wall St has no position in any stocks mentioned.
About SHSE:600281
Shanxi Huayang New MaterialLtd
Engages in the production and sale of precious metals, and biodegradable materials and products in China.
Very low with worrying balance sheet.
Market Insights

Community Narratives


