- China
- /
- Healthtech
- /
- SZSE:301337
Optimistic Investors Push Yarward Electronics (Shandong) Co., Ltd. (SZSE:301337) Shares Up 41% But Growth Is Lacking


Yarward Electronics (Shandong) Co., Ltd. (SZSE:301337) shareholders have had their patience rewarded with a 41% share price jump in the last month. While recent buyers may be laughing, long-term holders might not be as pleased since the recent gain only brings the stock back to where it started a year ago.
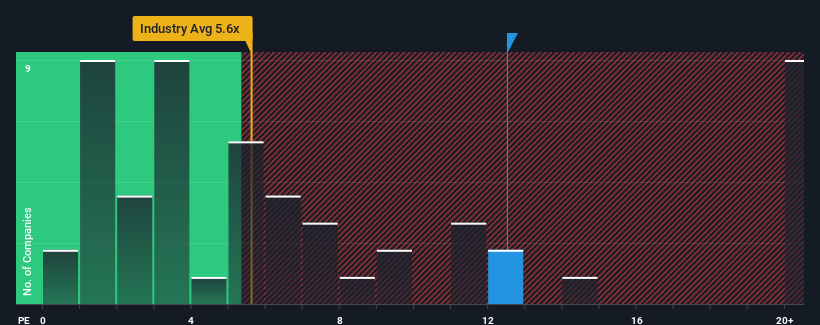
After such a large jump in price, when almost half of the companies in China's Healthcare Services industry have price-to-sales ratios (or "P/S") below 8.7x, you may consider Yarward Electronics (Shandong) as a stock probably not worth researching with its 12.5x P/S ratio. Nonetheless, we'd need to dig a little deeper to determine if there is a rational basis for the elevated P/S.
View our latest analysis for Yarward Electronics (Shandong)
What Does Yarward Electronics (Shandong)'s P/S Mean For Shareholders?
Revenue has risen firmly for Yarward Electronics (Shandong) recently, which is pleasing to see. It might be that many expect the respectable revenue performance to beat most other companies over the coming period, which has increased investors’ willingness to pay up for the stock. However, if this isn't the case, investors might get caught out paying too much for the stock.
We don't have analyst forecasts, but you can see how recent trends are setting up the company for the future by checking out our free report on Yarward Electronics (Shandong)'s earnings, revenue and cash flow.Do Revenue Forecasts Match The High P/S Ratio?
There's an inherent assumption that a company should outperform the industry for P/S ratios like Yarward Electronics (Shandong)'s to be considered reasonable.
Retrospectively, the last year delivered a decent 14% gain to the company's revenues. This was backed up an excellent period prior to see revenue up by 55% in total over the last three years. Therefore, it's fair to say the revenue growth recently has been superb for the company.
Comparing that to the industry, which is predicted to deliver 39% growth in the next 12 months, the company's momentum is weaker, based on recent medium-term annualised revenue results.
With this in mind, we find it worrying that Yarward Electronics (Shandong)'s P/S exceeds that of its industry peers. It seems most investors are ignoring the fairly limited recent growth rates and are hoping for a turnaround in the company's business prospects. There's a good chance existing shareholders are setting themselves up for future disappointment if the P/S falls to levels more in line with recent growth rates.
The Bottom Line On Yarward Electronics (Shandong)'s P/S
Yarward Electronics (Shandong) shares have taken a big step in a northerly direction, but its P/S is elevated as a result. We'd say the price-to-sales ratio's power isn't primarily as a valuation instrument but rather to gauge current investor sentiment and future expectations.
Our examination of Yarward Electronics (Shandong) revealed its poor three-year revenue trends aren't detracting from the P/S as much as we though, given they look worse than current industry expectations. Right now we aren't comfortable with the high P/S as this revenue performance isn't likely to support such positive sentiment for long. Unless the recent medium-term conditions improve markedly, it's very challenging to accept these the share price as being reasonable.
Don't forget that there may be other risks. For instance, we've identified 4 warning signs for Yarward Electronics (Shandong) (2 are a bit concerning) you should be aware of.
If companies with solid past earnings growth is up your alley, you may wish to see this free collection of other companies with strong earnings growth and low P/E ratios.
If you're looking to trade Yarward Electronics (Shandong), open an account with the lowest-cost platform trusted by professionals, Interactive Brokers.
With clients in over 200 countries and territories, and access to 160 markets, IBKR lets you trade stocks, options, futures, forex, bonds and funds from a single integrated account.
Enjoy no hidden fees, no account minimums, and FX conversion rates as low as 0.03%, far better than what most brokers offer.
Sponsored ContentNew: Manage All Your Stock Portfolios in One Place
We've created the ultimate portfolio companion for stock investors, and it's free.
• Connect an unlimited number of Portfolios and see your total in one currency
• Be alerted to new Warning Signs or Risks via email or mobile
• Track the Fair Value of your stocks
Have feedback on this article? Concerned about the content? Get in touch with us directly. Alternatively, email editorial-team (at) simplywallst.com.
This article by Simply Wall St is general in nature. We provide commentary based on historical data and analyst forecasts only using an unbiased methodology and our articles are not intended to be financial advice. It does not constitute a recommendation to buy or sell any stock, and does not take account of your objectives, or your financial situation. We aim to bring you long-term focused analysis driven by fundamental data. Note that our analysis may not factor in the latest price-sensitive company announcements or qualitative material. Simply Wall St has no position in any stocks mentioned.
About SZSE:301337
Yarward Electronics (Shandong)
Engages in the research and development, production, and sale of hospital intelligent communication interactive systems in China.
Mediocre balance sheet minimal.
Market Insights

Community Narratives

