
Advertisement
- China
- /
- Healthcare Services
- /
- SZSE:301293
The Returns On Capital At Sanbo Hospital Management Group (SZSE:301293) Don't Inspire Confidence

What are the early trends we should look for to identify a stock that could multiply in value over the long term? Ideally, a business will show two trends; firstly a growing return on capital employed (ROCE) and secondly, an increasing amount of capital employed. Basically this means that a company has profitable initiatives that it can continue to reinvest in, which is a trait of a compounding machine. However, after investigating Sanbo Hospital Management Group (SZSE:301293), we don't think it's current trends fit the mold of a multi-bagger.
What Is Return On Capital Employed (ROCE)?
Just to clarify if you're unsure, ROCE is a metric for evaluating how much pre-tax income (in percentage terms) a company earns on the capital invested in its business. Analysts use this formula to calculate it for Sanbo Hospital Management Group:
Return on Capital Employed = Earnings Before Interest and Tax (EBIT) ÷ (Total Assets - Current Liabilities)
0.05 = CN¥137m ÷ (CN¥3.1b - CN¥349m) (Based on the trailing twelve months to March 2024).
Thus, Sanbo Hospital Management Group has an ROCE of 5.0%. Ultimately, that's a low return and it under-performs the Healthcare industry average of 9.6%.
View our latest analysis for Sanbo Hospital Management Group
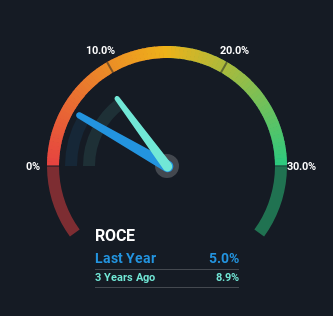
While the past is not representative of the future, it can be helpful to know how a company has performed historically, which is why we have this chart above. If you'd like to look at how Sanbo Hospital Management Group has performed in the past in other metrics, you can view this free graph of Sanbo Hospital Management Group's past earnings, revenue and cash flow.
The Trend Of ROCE
In terms of Sanbo Hospital Management Group's historical ROCE movements, the trend isn't fantastic. Around five years ago the returns on capital were 14%, but since then they've fallen to 5.0%. However, given capital employed and revenue have both increased it appears that the business is currently pursuing growth, at the consequence of short term returns. And if the increased capital generates additional returns, the business, and thus shareholders, will benefit in the long run.
On a side note, Sanbo Hospital Management Group has done well to pay down its current liabilities to 11% of total assets. So we could link some of this to the decrease in ROCE. What's more, this can reduce some aspects of risk to the business because now the company's suppliers or short-term creditors are funding less of its operations. Since the business is basically funding more of its operations with it's own money, you could argue this has made the business less efficient at generating ROCE.
What We Can Learn From Sanbo Hospital Management Group's ROCE
Even though returns on capital have fallen in the short term, we find it promising that revenue and capital employed have both increased for Sanbo Hospital Management Group. And there could be an opportunity here if other metrics look good too, because the stock has declined 41% in the last year. So we think it'd be worthwhile to look further into this stock given the trends look encouraging.
If you're still interested in Sanbo Hospital Management Group it's worth checking out our FREE intrinsic value approximation for 301293 to see if it's trading at an attractive price in other respects.
While Sanbo Hospital Management Group isn't earning the highest return, check out this free list of companies that are earning high returns on equity with solid balance sheets.
New: Manage All Your Stock Portfolios in One Place
We've created the ultimate portfolio companion for stock investors, and it's free.
• Connect an unlimited number of Portfolios and see your total in one currency
• Be alerted to new Warning Signs or Risks via email or mobile
• Track the Fair Value of your stocks
Have feedback on this article? Concerned about the content? Get in touch with us directly. Alternatively, email editorial-team (at) simplywallst.com.
This article by Simply Wall St is general in nature. We provide commentary based on historical data and analyst forecasts only using an unbiased methodology and our articles are not intended to be financial advice. It does not constitute a recommendation to buy or sell any stock, and does not take account of your objectives, or your financial situation. We aim to bring you long-term focused analysis driven by fundamental data. Note that our analysis may not factor in the latest price-sensitive company announcements or qualitative material. Simply Wall St has no position in any stocks mentioned.
About SZSE:301293
Sanbo Hospital Management Group
Operates a network of hospitals that provide medical services.
Excellent balance sheet with proven track record.
Market Insights

Advertisement
Community Narratives
Groundbreaking therapies that could change the treatment landscape for PTSD, fibromyalgia, MS & Alzheimer’s
Fair Value US$6.20|86.9% undervalued
CM
Community Contributor
DigitalOcean Will Grow 14% by Embracing AI with Paperspace Acquisition
Fair Value US$50.00|42.8% undervalued
NE
Community Contributor
Viant Technology: A Rising AdTech Challenger in the AI-Powered CTV Market
Fair Value US$38.61|66.0% undervalued
BL
Community Contributor
Volvo will Accelerate Forward into Electric and Autonomous Leadership in Five Years
Fair Value SEK 438.80|40.8% undervalued
UN
Community Contributor