- China
- /
- Medical Equipment
- /
- SZSE:300061
QITIAN Technology Group Co., Ltd.'s (SZSE:300061) Price Is Right But Growth Is Lacking After Shares Rocket 26%


QITIAN Technology Group Co., Ltd. (SZSE:300061) shareholders are no doubt pleased to see that the share price has bounced 26% in the last month, although it is still struggling to make up recently lost ground. Not all shareholders will be feeling jubilant, since the share price is still down a very disappointing 40% in the last twelve months.
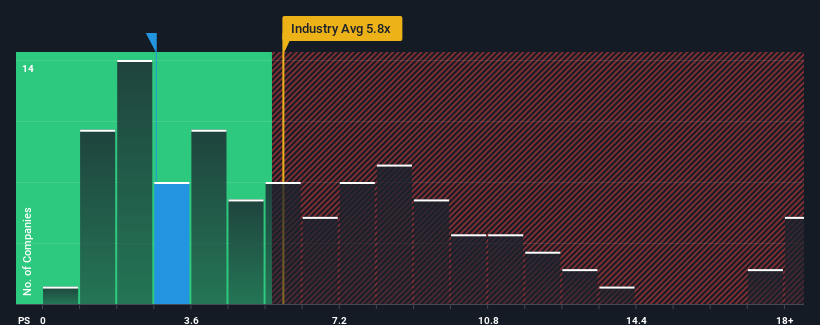
Although its price has surged higher, QITIAN Technology Group may still be sending very bullish signals at the moment with its price-to-sales (or "P/S") ratio of 2.7x, since almost half of all companies in the Medical Equipment industry in China have P/S ratios greater than 5.8x and even P/S higher than 10x are not unusual. However, the P/S might be quite low for a reason and it requires further investigation to determine if it's justified.
View our latest analysis for QITIAN Technology Group
What Does QITIAN Technology Group's Recent Performance Look Like?
For instance, QITIAN Technology Group's receding revenue in recent times would have to be some food for thought. One possibility is that the P/S is low because investors think the company won't do enough to avoid underperforming the broader industry in the near future. However, if this doesn't eventuate then existing shareholders may be feeling optimistic about the future direction of the share price.
Want the full picture on earnings, revenue and cash flow for the company? Then our free report on QITIAN Technology Group will help you shine a light on its historical performance.What Are Revenue Growth Metrics Telling Us About The Low P/S?
There's an inherent assumption that a company should far underperform the industry for P/S ratios like QITIAN Technology Group's to be considered reasonable.
Retrospectively, the last year delivered a frustrating 12% decrease to the company's top line. This means it has also seen a slide in revenue over the longer-term as revenue is down 19% in total over the last three years. Accordingly, shareholders would have felt downbeat about the medium-term rates of revenue growth.
In contrast to the company, the rest of the industry is expected to grow by 26% over the next year, which really puts the company's recent medium-term revenue decline into perspective.
With this information, we are not surprised that QITIAN Technology Group is trading at a P/S lower than the industry. Nonetheless, there's no guarantee the P/S has reached a floor yet with revenue going in reverse. There's potential for the P/S to fall to even lower levels if the company doesn't improve its top-line growth.
What We Can Learn From QITIAN Technology Group's P/S?
QITIAN Technology Group's recent share price jump still sees fails to bring its P/S alongside the industry median. Generally, our preference is to limit the use of the price-to-sales ratio to establishing what the market thinks about the overall health of a company.
It's no surprise that QITIAN Technology Group maintains its low P/S off the back of its sliding revenue over the medium-term. Right now shareholders are accepting the low P/S as they concede future revenue probably won't provide any pleasant surprises either. If recent medium-term revenue trends continue, it's hard to see the share price moving strongly in either direction in the near future under these circumstances.
It's always necessary to consider the ever-present spectre of investment risk. We've identified 1 warning sign with QITIAN Technology Group, and understanding should be part of your investment process.
If these risks are making you reconsider your opinion on QITIAN Technology Group, explore our interactive list of high quality stocks to get an idea of what else is out there.
Valuation is complex, but we're here to simplify it.
Discover if QITIAN Technology Group might be undervalued or overvalued with our detailed analysis, featuring fair value estimates, potential risks, dividends, insider trades, and its financial condition.
Access Free AnalysisHave feedback on this article? Concerned about the content? Get in touch with us directly. Alternatively, email editorial-team (at) simplywallst.com.
This article by Simply Wall St is general in nature. We provide commentary based on historical data and analyst forecasts only using an unbiased methodology and our articles are not intended to be financial advice. It does not constitute a recommendation to buy or sell any stock, and does not take account of your objectives, or your financial situation. We aim to bring you long-term focused analysis driven by fundamental data. Note that our analysis may not factor in the latest price-sensitive company announcements or qualitative material. Simply Wall St has no position in any stocks mentioned.
About SZSE:300061
QITIAN Technology Group
Develops, produces, and sells plastic lenses in China.
Adequate balance sheet minimal.
Similar Companies
Market Insights

Community Narratives


