- China
- /
- Medical Equipment
- /
- SHSE:688161
After Leaping 45% Shandong Weigao Orthopaedic Device Co., Ltd (SHSE:688161) Shares Are Not Flying Under The Radar

Shandong Weigao Orthopaedic Device Co., Ltd (SHSE:688161) shares have continued their recent momentum with a 45% gain in the last month alone. Unfortunately, the gains of the last month did little to right the losses of the last year with the stock still down 17% over that time.
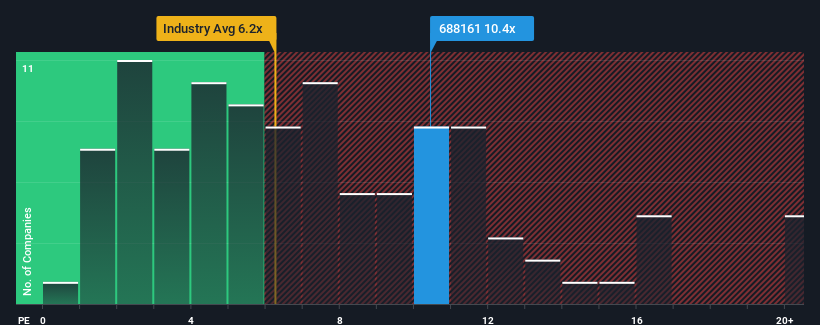
Following the firm bounce in price, Shandong Weigao Orthopaedic Device's price-to-sales (or "P/S") ratio of 10.4x might make it look like a strong sell right now compared to other companies in the Medical Equipment industry in China, where around half of the companies have P/S ratios below 6.2x and even P/S below 3x are quite common. Although, it's not wise to just take the P/S at face value as there may be an explanation why it's so lofty.
See our latest analysis for Shandong Weigao Orthopaedic Device

How Shandong Weigao Orthopaedic Device Has Been Performing
While the industry has experienced revenue growth lately, Shandong Weigao Orthopaedic Device's revenue has gone into reverse gear, which is not great. One possibility is that the P/S ratio is high because investors think this poor revenue performance will turn the corner. However, if this isn't the case, investors might get caught out paying too much for the stock.
If you'd like to see what analysts are forecasting going forward, you should check out our free report on Shandong Weigao Orthopaedic Device.How Is Shandong Weigao Orthopaedic Device's Revenue Growth Trending?
There's an inherent assumption that a company should far outperform the industry for P/S ratios like Shandong Weigao Orthopaedic Device's to be considered reasonable.
Taking a look back first, the company's revenue growth last year wasn't something to get excited about as it posted a disappointing decline of 26%. The last three years don't look nice either as the company has shrunk revenue by 41% in aggregate. So unfortunately, we have to acknowledge that the company has not done a great job of growing revenue over that time.
Shifting to the future, estimates from the one analyst covering the company suggest revenue should grow by 32% over the next year. With the industry only predicted to deliver 27%, the company is positioned for a stronger revenue result.
In light of this, it's understandable that Shandong Weigao Orthopaedic Device's P/S sits above the majority of other companies. It seems most investors are expecting this strong future growth and are willing to pay more for the stock.
The Bottom Line On Shandong Weigao Orthopaedic Device's P/S
Shandong Weigao Orthopaedic Device's P/S has grown nicely over the last month thanks to a handy boost in the share price. It's argued the price-to-sales ratio is an inferior measure of value within certain industries, but it can be a powerful business sentiment indicator.
We've established that Shandong Weigao Orthopaedic Device maintains its high P/S on the strength of its forecasted revenue growth being higher than the the rest of the Medical Equipment industry, as expected. At this stage investors feel the potential for a deterioration in revenues is quite remote, justifying the elevated P/S ratio. Unless these conditions change, they will continue to provide strong support to the share price.
It's always necessary to consider the ever-present spectre of investment risk. We've identified 1 warning sign with Shandong Weigao Orthopaedic Device, and understanding should be part of your investment process.
Of course, profitable companies with a history of great earnings growth are generally safer bets. So you may wish to see this free collection of other companies that have reasonable P/E ratios and have grown earnings strongly.
If you're looking to trade Shandong Weigao Orthopaedic Device, open an account with the lowest-cost platform trusted by professionals, Interactive Brokers.
With clients in over 200 countries and territories, and access to 160 markets, IBKR lets you trade stocks, options, futures, forex, bonds and funds from a single integrated account.
Enjoy no hidden fees, no account minimums, and FX conversion rates as low as 0.03%, far better than what most brokers offer.
Sponsored ContentNew: Manage All Your Stock Portfolios in One Place
We've created the ultimate portfolio companion for stock investors, and it's free.
• Connect an unlimited number of Portfolios and see your total in one currency
• Be alerted to new Warning Signs or Risks via email or mobile
• Track the Fair Value of your stocks
Have feedback on this article? Concerned about the content? Get in touch with us directly. Alternatively, email editorial-team (at) simplywallst.com.
This article by Simply Wall St is general in nature. We provide commentary based on historical data and analyst forecasts only using an unbiased methodology and our articles are not intended to be financial advice. It does not constitute a recommendation to buy or sell any stock, and does not take account of your objectives, or your financial situation. We aim to bring you long-term focused analysis driven by fundamental data. Note that our analysis may not factor in the latest price-sensitive company announcements or qualitative material. Simply Wall St has no position in any stocks mentioned.
About SHSE:688161
Shandong Weigao Orthopaedic Device
Shandong Weigao Orthopaedic Device Co., Ltd.
Flawless balance sheet with proven track record.
Similar Companies
Market Insights
Community Narratives


