- China
- /
- Medical Equipment
- /
- SHSE:688085
Shanghai Sanyou Medical Co., Ltd's (SHSE:688085) 26% Jump Shows Its Popularity With Investors

Despite an already strong run, Shanghai Sanyou Medical Co., Ltd (SHSE:688085) shares have been powering on, with a gain of 26% in the last thirty days. The bad news is that even after the stocks recovery in the last 30 days, shareholders are still underwater by about 2.4% over the last year.
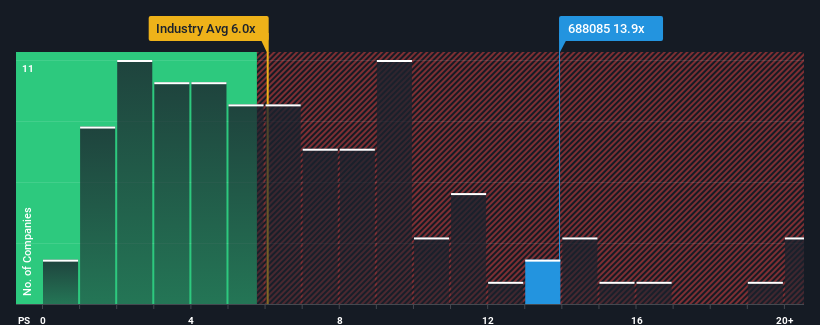
After such a large jump in price, Shanghai Sanyou Medical's price-to-sales (or "P/S") ratio of 13.9x might make it look like a strong sell right now compared to other companies in the Medical Equipment industry in China, where around half of the companies have P/S ratios below 6x and even P/S below 3x are quite common. However, the P/S might be quite high for a reason and it requires further investigation to determine if it's justified.
See our latest analysis for Shanghai Sanyou Medical

How Shanghai Sanyou Medical Has Been Performing
Shanghai Sanyou Medical hasn't been tracking well recently as its declining revenue compares poorly to other companies, which have seen some growth in their revenues on average. It might be that many expect the dour revenue performance to recover substantially, which has kept the P/S from collapsing. However, if this isn't the case, investors might get caught out paying too much for the stock.
Keen to find out how analysts think Shanghai Sanyou Medical's future stacks up against the industry? In that case, our free report is a great place to start.What Are Revenue Growth Metrics Telling Us About The High P/S?
There's an inherent assumption that a company should far outperform the industry for P/S ratios like Shanghai Sanyou Medical's to be considered reasonable.
Taking a look back first, the company's revenue growth last year wasn't something to get excited about as it posted a disappointing decline of 39%. The last three years don't look nice either as the company has shrunk revenue by 22% in aggregate. Accordingly, shareholders would have felt downbeat about the medium-term rates of revenue growth.
Turning to the outlook, the next year should generate growth of 61% as estimated by the two analysts watching the company. With the industry only predicted to deliver 28%, the company is positioned for a stronger revenue result.
With this information, we can see why Shanghai Sanyou Medical is trading at such a high P/S compared to the industry. Apparently shareholders aren't keen to offload something that is potentially eyeing a more prosperous future.
The Final Word
Shanghai Sanyou Medical's P/S has grown nicely over the last month thanks to a handy boost in the share price. We'd say the price-to-sales ratio's power isn't primarily as a valuation instrument but rather to gauge current investor sentiment and future expectations.
As we suspected, our examination of Shanghai Sanyou Medical's analyst forecasts revealed that its superior revenue outlook is contributing to its high P/S. At this stage investors feel the potential for a deterioration in revenues is quite remote, justifying the elevated P/S ratio. It's hard to see the share price falling strongly in the near future under these circumstances.
Before you settle on your opinion, we've discovered 2 warning signs for Shanghai Sanyou Medical that you should be aware of.
If you're unsure about the strength of Shanghai Sanyou Medical's business, why not explore our interactive list of stocks with solid business fundamentals for some other companies you may have missed.
New: Manage All Your Stock Portfolios in One Place
We've created the ultimate portfolio companion for stock investors, and it's free.
• Connect an unlimited number of Portfolios and see your total in one currency
• Be alerted to new Warning Signs or Risks via email or mobile
• Track the Fair Value of your stocks
Have feedback on this article? Concerned about the content? Get in touch with us directly. Alternatively, email editorial-team (at) simplywallst.com.
This article by Simply Wall St is general in nature. We provide commentary based on historical data and analyst forecasts only using an unbiased methodology and our articles are not intended to be financial advice. It does not constitute a recommendation to buy or sell any stock, and does not take account of your objectives, or your financial situation. We aim to bring you long-term focused analysis driven by fundamental data. Note that our analysis may not factor in the latest price-sensitive company announcements or qualitative material. Simply Wall St has no position in any stocks mentioned.
About SHSE:688085
Shanghai Sanyou Medical
Researches, develops, manufactures, and sells orthopedics implants in China.
High growth potential with excellent balance sheet.
Market Insights
Community Narratives


