- China
- /
- Medical Equipment
- /
- SHSE:600587
Estimating The Fair Value Of Shinva Medical Instrument Co.,Ltd. (SHSE:600587)


Key Insights
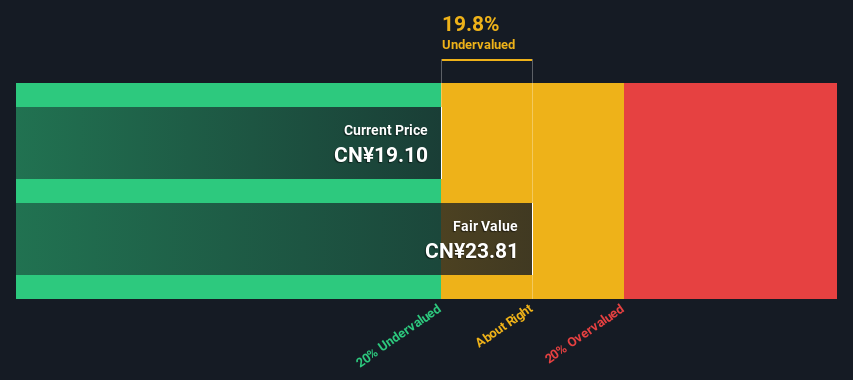
- Using the 2 Stage Free Cash Flow to Equity, Shinva Medical InstrumentLtd fair value estimate is CN¥23.81
- Current share price of CN¥19.10 suggests Shinva Medical InstrumentLtd is potentially trading close to its fair value
- Shinva Medical InstrumentLtd's peers are currently trading at a premium of 440% on average
Today we will run through one way of estimating the intrinsic value of Shinva Medical Instrument Co.,Ltd. (SHSE:600587) by projecting its future cash flows and then discounting them to today's value. We will take advantage of the Discounted Cash Flow (DCF) model for this purpose. Models like these may appear beyond the comprehension of a lay person, but they're fairly easy to follow.
Companies can be valued in a lot of ways, so we would point out that a DCF is not perfect for every situation. If you still have some burning questions about this type of valuation, take a look at the Simply Wall St analysis model.
Check out our latest analysis for Shinva Medical InstrumentLtd
Step By Step Through The Calculation
We use what is known as a 2-stage model, which simply means we have two different periods of growth rates for the company's cash flows. Generally the first stage is higher growth, and the second stage is a lower growth phase. To start off with, we need to estimate the next ten years of cash flows. Seeing as no analyst estimates of free cash flow are available to us, we have extrapolate the previous free cash flow (FCF) from the company's last reported value. We assume companies with shrinking free cash flow will slow their rate of shrinkage, and that companies with growing free cash flow will see their growth rate slow, over this period. We do this to reflect that growth tends to slow more in the early years than it does in later years.
Generally we assume that a dollar today is more valuable than a dollar in the future, so we discount the value of these future cash flows to their estimated value in today's dollars:
10-year free cash flow (FCF) estimate
| 2025 | 2026 | 2027 | 2028 | 2029 | 2030 | 2031 | 2032 | 2033 | 2034 | |
| Levered FCF (CN¥, Millions) | CN¥540.2m | CN¥606.9m | CN¥664.5m | CN¥714.4m | CN¥758.1m | CN¥797.0m | CN¥832.4m | CN¥865.4m | CN¥896.9m | CN¥927.4m |
| Growth Rate Estimate Source | Est @ 16.42% | Est @ 12.35% | Est @ 9.50% | Est @ 7.51% | Est @ 6.11% | Est @ 5.13% | Est @ 4.45% | Est @ 3.97% | Est @ 3.63% | Est @ 3.40% |
| Present Value (CN¥, Millions) Discounted @ 7.7% | CN¥502 | CN¥523 | CN¥532 | CN¥532 | CN¥524 | CN¥511 | CN¥496 | CN¥479 | CN¥461 | CN¥443 |
("Est" = FCF growth rate estimated by Simply Wall St)
Present Value of 10-year Cash Flow (PVCF) = CN¥5.0b
After calculating the present value of future cash flows in the initial 10-year period, we need to calculate the Terminal Value, which accounts for all future cash flows beyond the first stage. For a number of reasons a very conservative growth rate is used that cannot exceed that of a country's GDP growth. In this case we have used the 5-year average of the 10-year government bond yield (2.9%) to estimate future growth. In the same way as with the 10-year 'growth' period, we discount future cash flows to today's value, using a cost of equity of 7.7%.
Terminal Value (TV)= FCF2034 × (1 + g) ÷ (r – g) = CN¥927m× (1 + 2.9%) ÷ (7.7%– 2.9%) = CN¥20b
Present Value of Terminal Value (PVTV)= TV / (1 + r)10= CN¥20b÷ ( 1 + 7.7%)10= CN¥9.4b
The total value, or equity value, is then the sum of the present value of the future cash flows, which in this case is CN¥14b. In the final step we divide the equity value by the number of shares outstanding. Compared to the current share price of CN¥19.1, the company appears about fair value at a 20% discount to where the stock price trades currently. Remember though, that this is just an approximate valuation, and like any complex formula - garbage in, garbage out.
Important Assumptions
The calculation above is very dependent on two assumptions. The first is the discount rate and the other is the cash flows. If you don't agree with these result, have a go at the calculation yourself and play with the assumptions. The DCF also does not consider the possible cyclicality of an industry, or a company's future capital requirements, so it does not give a full picture of a company's potential performance. Given that we are looking at Shinva Medical InstrumentLtd as potential shareholders, the cost of equity is used as the discount rate, rather than the cost of capital (or weighted average cost of capital, WACC) which accounts for debt. In this calculation we've used 7.7%, which is based on a levered beta of 0.968. Beta is a measure of a stock's volatility, compared to the market as a whole. We get our beta from the industry average beta of globally comparable companies, with an imposed limit between 0.8 and 2.0, which is a reasonable range for a stable business.
SWOT Analysis for Shinva Medical InstrumentLtd
- Earnings growth over the past year exceeded the industry.
- Debt is not viewed as a risk.
- Dividends are covered by earnings and cash flows.
- Dividend is low compared to the top 25% of dividend payers in the Medical Equipment market.
- Annual earnings are forecast to grow for the next 3 years.
- Good value based on P/E ratio and estimated fair value.
- No apparent threats visible for 600587.
Looking Ahead:
Although the valuation of a company is important, it ideally won't be the sole piece of analysis you scrutinize for a company. DCF models are not the be-all and end-all of investment valuation. Instead the best use for a DCF model is to test certain assumptions and theories to see if they would lead to the company being undervalued or overvalued. For example, changes in the company's cost of equity or the risk free rate can significantly impact the valuation. For Shinva Medical InstrumentLtd, there are three pertinent elements you should assess:
- Risks: To that end, you should be aware of the 1 warning sign we've spotted with Shinva Medical InstrumentLtd .
- Future Earnings: How does 600587's growth rate compare to its peers and the wider market? Dig deeper into the analyst consensus number for the upcoming years by interacting with our free analyst growth expectation chart.
- Other High Quality Alternatives: Do you like a good all-rounder? Explore our interactive list of high quality stocks to get an idea of what else is out there you may be missing!
PS. The Simply Wall St app conducts a discounted cash flow valuation for every stock on the SHSE every day. If you want to find the calculation for other stocks just search here.
If you're looking to trade Shinva Medical InstrumentLtd, open an account with the lowest-cost platform trusted by professionals, Interactive Brokers.
With clients in over 200 countries and territories, and access to 160 markets, IBKR lets you trade stocks, options, futures, forex, bonds and funds from a single integrated account.
Enjoy no hidden fees, no account minimums, and FX conversion rates as low as 0.03%, far better than what most brokers offer.
Sponsored ContentNew: Manage All Your Stock Portfolios in One Place
We've created the ultimate portfolio companion for stock investors, and it's free.
• Connect an unlimited number of Portfolios and see your total in one currency
• Be alerted to new Warning Signs or Risks via email or mobile
• Track the Fair Value of your stocks
Have feedback on this article? Concerned about the content? Get in touch with us directly. Alternatively, email editorial-team (at) simplywallst.com.
This article by Simply Wall St is general in nature. We provide commentary based on historical data and analyst forecasts only using an unbiased methodology and our articles are not intended to be financial advice. It does not constitute a recommendation to buy or sell any stock, and does not take account of your objectives, or your financial situation. We aim to bring you long-term focused analysis driven by fundamental data. Note that our analysis may not factor in the latest price-sensitive company announcements or qualitative material. Simply Wall St has no position in any stocks mentioned.
About SHSE:600587
Shinva Medical InstrumentLtd
Provides medical devices, pharmaceutical equipment, medical services, and medical trade in the People’s Republic of China.
Flawless balance sheet and fair value.
Market Insights

Community Narratives

