
Advertisement
There's No Escaping Shanghai Xuerong Biotechnology Co.,Ltd.'s (SZSE:300511) Muted Revenues Despite A 25% Share Price Rise
Despite an already strong run, Shanghai Xuerong Biotechnology Co.,Ltd. (SZSE:300511) shares have been powering on, with a gain of 25% in the last thirty days. Not all shareholders will be feeling jubilant, since the share price is still down a very disappointing 35% in the last twelve months.
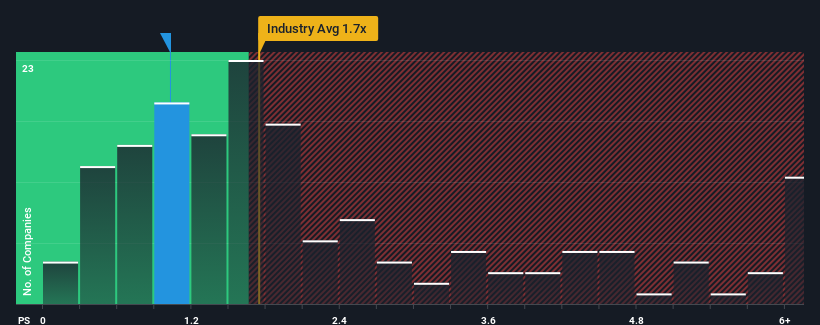
Even after such a large jump in price, Shanghai Xuerong BiotechnologyLtd may still be sending bullish signals at the moment with its price-to-sales (or "P/S") ratio of 1x, since almost half of all companies in the Food industry in China have P/S ratios greater than 1.7x and even P/S higher than 4x are not unusual. Nonetheless, we'd need to dig a little deeper to determine if there is a rational basis for the reduced P/S.
See our latest analysis for Shanghai Xuerong BiotechnologyLtd
What Does Shanghai Xuerong BiotechnologyLtd's Recent Performance Look Like?
For example, consider that Shanghai Xuerong BiotechnologyLtd's financial performance has been poor lately as its revenue has been in decline. One possibility is that the P/S is low because investors think the company won't do enough to avoid underperforming the broader industry in the near future. However, if this doesn't eventuate then existing shareholders may be feeling optimistic about the future direction of the share price.
Although there are no analyst estimates available for Shanghai Xuerong BiotechnologyLtd, take a look at this free data-rich visualisation to see how the company stacks up on earnings, revenue and cash flow.Do Revenue Forecasts Match The Low P/S Ratio?
The only time you'd be truly comfortable seeing a P/S as low as Shanghai Xuerong BiotechnologyLtd's is when the company's growth is on track to lag the industry.
Retrospectively, the last year delivered a frustrating 10% decrease to the company's top line. That put a dampener on the good run it was having over the longer-term as its three-year revenue growth is still a noteworthy 7.3% in total. Accordingly, while they would have preferred to keep the run going, shareholders would be roughly satisfied with the medium-term rates of revenue growth.
This is in contrast to the rest of the industry, which is expected to grow by 10% over the next year, materially higher than the company's recent medium-term annualised growth rates.
In light of this, it's understandable that Shanghai Xuerong BiotechnologyLtd's P/S sits below the majority of other companies. Apparently many shareholders weren't comfortable holding on to something they believe will continue to trail the wider industry.
The Key Takeaway
Despite Shanghai Xuerong BiotechnologyLtd's share price climbing recently, its P/S still lags most other companies. While the price-to-sales ratio shouldn't be the defining factor in whether you buy a stock or not, it's quite a capable barometer of revenue expectations.
Our examination of Shanghai Xuerong BiotechnologyLtd confirms that the company's revenue trends over the past three-year years are a key factor in its low price-to-sales ratio, as we suspected, given they fall short of current industry expectations. Right now shareholders are accepting the low P/S as they concede future revenue probably won't provide any pleasant surprises. Unless the recent medium-term conditions improve, they will continue to form a barrier for the share price around these levels.
Before you take the next step, you should know about the 3 warning signs for Shanghai Xuerong BiotechnologyLtd (2 shouldn't be ignored!) that we have uncovered.
If these risks are making you reconsider your opinion on Shanghai Xuerong BiotechnologyLtd, explore our interactive list of high quality stocks to get an idea of what else is out there.
New: Manage All Your Stock Portfolios in One Place
We've created the ultimate portfolio companion for stock investors, and it's free.
• Connect an unlimited number of Portfolios and see your total in one currency
• Be alerted to new Warning Signs or Risks via email or mobile
• Track the Fair Value of your stocks
Have feedback on this article? Concerned about the content? Get in touch with us directly. Alternatively, email editorial-team (at) simplywallst.com.
This article by Simply Wall St is general in nature. We provide commentary based on historical data and analyst forecasts only using an unbiased methodology and our articles are not intended to be financial advice. It does not constitute a recommendation to buy or sell any stock, and does not take account of your objectives, or your financial situation. We aim to bring you long-term focused analysis driven by fundamental data. Note that our analysis may not factor in the latest price-sensitive company announcements or qualitative material. Simply Wall St has no position in any stocks mentioned.
About SZSE:300511
Shanghai Xuerong BiotechnologyLtd
Engages in the research and development, industrial planting, and sale of fresh edible mushrooms in the People’s Republic of China.
Imperfect balance sheet with very low risk.
Market Insights

Advertisement
Community Narratives
100% Patient Improvement in trial puts this $16M Biotech on the radar
Fair Value US$5.30|65.7% undervalued
JO
Community Contributor
Exxon Mobil's 17.5% Upside Promises Industry-Leading Returns in Energy Transition
Fair Value US$132.00|14.9% undervalued
HE
Community Contributor
NHC Analysis: Quality at a Good Price. A Golden Opportunity?
Fair Value US$179.80|35.4% undervalued
DA
Community Contributor
Product Refresh And Global Expansion Will Empower Future Market Leadership
Fair Value US$202.60|21.0% undervalued
AN
Based on Analyst Price Targets