Is Henan Shuanghui Investment & Development Co.,Ltd. (SZSE:000895) Worth CN¥26.7 Based On Its Intrinsic Value?


Key Insights
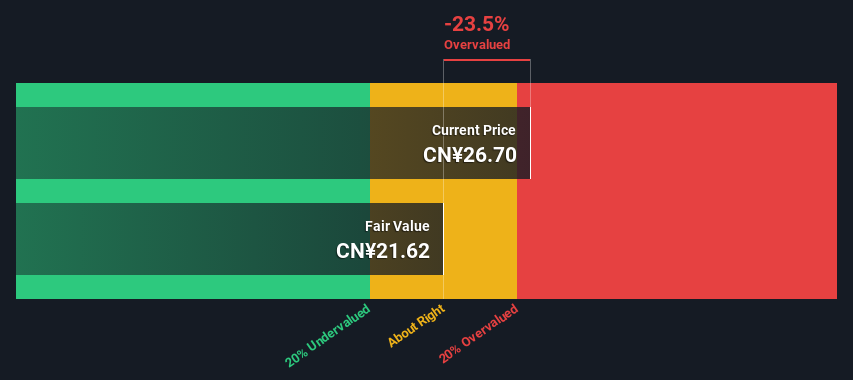
- The projected fair value for Henan Shuanghui Investment & DevelopmentLtd is CN¥21.62 based on 2 Stage Free Cash Flow to Equity
- Current share price of CN¥26.70 suggests Henan Shuanghui Investment & DevelopmentLtd is potentially 24% overvalued
- Our fair value estimate is 24% lower than Henan Shuanghui Investment & DevelopmentLtd's analyst price target of CN¥28.60
How far off is Henan Shuanghui Investment & Development Co.,Ltd. (SZSE:000895) from its intrinsic value? Using the most recent financial data, we'll take a look at whether the stock is fairly priced by taking the forecast future cash flows of the company and discounting them back to today's value. The Discounted Cash Flow (DCF) model is the tool we will apply to do this. Believe it or not, it's not too difficult to follow, as you'll see from our example!
We would caution that there are many ways of valuing a company and, like the DCF, each technique has advantages and disadvantages in certain scenarios. Anyone interested in learning a bit more about intrinsic value should have a read of the Simply Wall St analysis model.
See our latest analysis for Henan Shuanghui Investment & DevelopmentLtd
Crunching The Numbers
We are going to use a two-stage DCF model, which, as the name states, takes into account two stages of growth. The first stage is generally a higher growth period which levels off heading towards the terminal value, captured in the second 'steady growth' period. To start off with, we need to estimate the next ten years of cash flows. Where possible we use analyst estimates, but when these aren't available we extrapolate the previous free cash flow (FCF) from the last estimate or reported value. We assume companies with shrinking free cash flow will slow their rate of shrinkage, and that companies with growing free cash flow will see their growth rate slow, over this period. We do this to reflect that growth tends to slow more in the early years than it does in later years.
A DCF is all about the idea that a dollar in the future is less valuable than a dollar today, and so the sum of these future cash flows is then discounted to today's value:
10-year free cash flow (FCF) estimate
| 2024 | 2025 | 2026 | 2027 | 2028 | 2029 | 2030 | 2031 | 2032 | 2033 | |
| Levered FCF (CN¥, Millions) | CN¥8.82b | CN¥5.36b | CN¥4.55b | CN¥4.11b | CN¥3.86b | CN¥3.74b | CN¥3.68b | CN¥3.68b | CN¥3.71b | CN¥3.76b |
| Growth Rate Estimate Source | Analyst x1 | Analyst x1 | Analyst x1 | Est @ -9.72% | Est @ -5.93% | Est @ -3.28% | Est @ -1.43% | Est @ -0.13% | Est @ 0.78% | Est @ 1.42% |
| Present Value (CN¥, Millions) Discounted @ 7.4% | CN¥8.2k | CN¥4.6k | CN¥3.7k | CN¥3.1k | CN¥2.7k | CN¥2.4k | CN¥2.2k | CN¥2.1k | CN¥1.9k | CN¥1.8k |
("Est" = FCF growth rate estimated by Simply Wall St)
Present Value of 10-year Cash Flow (PVCF) = CN¥33b
We now need to calculate the Terminal Value, which accounts for all the future cash flows after this ten year period. For a number of reasons a very conservative growth rate is used that cannot exceed that of a country's GDP growth. In this case we have used the 5-year average of the 10-year government bond yield (2.9%) to estimate future growth. In the same way as with the 10-year 'growth' period, we discount future cash flows to today's value, using a cost of equity of 7.4%.
Terminal Value (TV)= FCF2033 × (1 + g) ÷ (r – g) = CN¥3.8b× (1 + 2.9%) ÷ (7.4%– 2.9%) = CN¥86b
Present Value of Terminal Value (PVTV)= TV / (1 + r)10= CN¥86b÷ ( 1 + 7.4%)10= CN¥42b
The total value, or equity value, is then the sum of the present value of the future cash flows, which in this case is CN¥75b. To get the intrinsic value per share, we divide this by the total number of shares outstanding. Relative to the current share price of CN¥26.7, the company appears slightly overvalued at the time of writing. Remember though, that this is just an approximate valuation, and like any complex formula - garbage in, garbage out.
The Assumptions
We would point out that the most important inputs to a discounted cash flow are the discount rate and of course the actual cash flows. Part of investing is coming up with your own evaluation of a company's future performance, so try the calculation yourself and check your own assumptions. The DCF also does not consider the possible cyclicality of an industry, or a company's future capital requirements, so it does not give a full picture of a company's potential performance. Given that we are looking at Henan Shuanghui Investment & DevelopmentLtd as potential shareholders, the cost of equity is used as the discount rate, rather than the cost of capital (or weighted average cost of capital, WACC) which accounts for debt. In this calculation we've used 7.4%, which is based on a levered beta of 0.800. Beta is a measure of a stock's volatility, compared to the market as a whole. We get our beta from the industry average beta of globally comparable companies, with an imposed limit between 0.8 and 2.0, which is a reasonable range for a stable business.
SWOT Analysis for Henan Shuanghui Investment & DevelopmentLtd
- Debt is not viewed as a risk.
- Dividend is in the top 25% of dividend payers in the market.
- Earnings declined over the past year.
- Annual earnings are forecast to grow for the next 3 years.
- Good value based on P/E ratio compared to estimated Fair P/E ratio.
- Dividends are not covered by earnings and cashflows.
- Annual earnings are forecast to grow slower than the Chinese market.
Moving On:
Valuation is only one side of the coin in terms of building your investment thesis, and it ideally won't be the sole piece of analysis you scrutinize for a company. DCF models are not the be-all and end-all of investment valuation. Preferably you'd apply different cases and assumptions and see how they would impact the company's valuation. For instance, if the terminal value growth rate is adjusted slightly, it can dramatically alter the overall result. Why is the intrinsic value lower than the current share price? For Henan Shuanghui Investment & DevelopmentLtd, we've compiled three fundamental items you should assess:
- Risks: You should be aware of the 1 warning sign for Henan Shuanghui Investment & DevelopmentLtd we've uncovered before considering an investment in the company.
- Future Earnings: How does 000895's growth rate compare to its peers and the wider market? Dig deeper into the analyst consensus number for the upcoming years by interacting with our free analyst growth expectation chart.
- Other High Quality Alternatives: Do you like a good all-rounder? Explore our interactive list of high quality stocks to get an idea of what else is out there you may be missing!
PS. The Simply Wall St app conducts a discounted cash flow valuation for every stock on the SZSE every day. If you want to find the calculation for other stocks just search here.
Valuation is complex, but we're here to simplify it.
Discover if Henan Shuanghui Investment & DevelopmentLtd might be undervalued or overvalued with our detailed analysis, featuring fair value estimates, potential risks, dividends, insider trades, and its financial condition.
Access Free AnalysisHave feedback on this article? Concerned about the content? Get in touch with us directly. Alternatively, email editorial-team (at) simplywallst.com.
This article by Simply Wall St is general in nature. We provide commentary based on historical data and analyst forecasts only using an unbiased methodology and our articles are not intended to be financial advice. It does not constitute a recommendation to buy or sell any stock, and does not take account of your objectives, or your financial situation. We aim to bring you long-term focused analysis driven by fundamental data. Note that our analysis may not factor in the latest price-sensitive company announcements or qualitative material. Simply Wall St has no position in any stocks mentioned.
About SZSE:000895
Henan Shuanghui Investment & DevelopmentLtd
Henan Shuanghui Investment & Development Co.,Ltd.
Excellent balance sheet, good value and pays a dividend.
Similar Companies
Market Insights

Community Narratives


