Are Investors Undervaluing Henan Shuanghui Investment & Development Co.,Ltd. (SZSE:000895) By 29%?


Key Insights
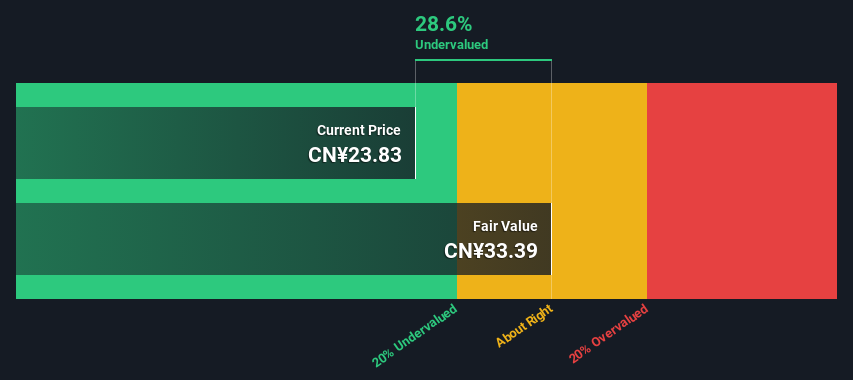
- The projected fair value for Henan Shuanghui Investment & DevelopmentLtd is CN¥33.39 based on 2 Stage Free Cash Flow to Equity
- Henan Shuanghui Investment & DevelopmentLtd is estimated to be 29% undervalued based on current share price of CN¥23.83
- Our fair value estimate is 26% higher than Henan Shuanghui Investment & DevelopmentLtd's analyst price target of CN¥26.58
How far off is Henan Shuanghui Investment & Development Co.,Ltd. (SZSE:000895) from its intrinsic value? Using the most recent financial data, we'll take a look at whether the stock is fairly priced by taking the forecast future cash flows of the company and discounting them back to today's value. Our analysis will employ the Discounted Cash Flow (DCF) model. Models like these may appear beyond the comprehension of a lay person, but they're fairly easy to follow.
Remember though, that there are many ways to estimate a company's value, and a DCF is just one method. Anyone interested in learning a bit more about intrinsic value should have a read of the Simply Wall St analysis model.
View our latest analysis for Henan Shuanghui Investment & DevelopmentLtd
Is Henan Shuanghui Investment & DevelopmentLtd Fairly Valued?
We use what is known as a 2-stage model, which simply means we have two different periods of growth rates for the company's cash flows. Generally the first stage is higher growth, and the second stage is a lower growth phase. To start off with, we need to estimate the next ten years of cash flows. Where possible we use analyst estimates, but when these aren't available we extrapolate the previous free cash flow (FCF) from the last estimate or reported value. We assume companies with shrinking free cash flow will slow their rate of shrinkage, and that companies with growing free cash flow will see their growth rate slow, over this period. We do this to reflect that growth tends to slow more in the early years than it does in later years.
A DCF is all about the idea that a dollar in the future is less valuable than a dollar today, and so the sum of these future cash flows is then discounted to today's value:
10-year free cash flow (FCF) estimate
| 2025 | 2026 | 2027 | 2028 | 2029 | 2030 | 2031 | 2032 | 2033 | 2034 | |
| Levered FCF (CN¥, Millions) | CN¥5.33b | CN¥5.20b | CN¥5.16b | CN¥5.18b | CN¥5.24b | CN¥5.32b | CN¥5.43b | CN¥5.55b | CN¥5.69b | CN¥5.83b |
| Growth Rate Estimate Source | Analyst x2 | Analyst x2 | Est @ -0.71% | Est @ 0.36% | Est @ 1.11% | Est @ 1.63% | Est @ 2.00% | Est @ 2.25% | Est @ 2.43% | Est @ 2.56% |
| Present Value (CN¥, Millions) Discounted @ 6.8% | CN¥5.0k | CN¥4.6k | CN¥4.2k | CN¥4.0k | CN¥3.8k | CN¥3.6k | CN¥3.4k | CN¥3.3k | CN¥3.1k | CN¥3.0k |
("Est" = FCF growth rate estimated by Simply Wall St)
Present Value of 10-year Cash Flow (PVCF) = CN¥38b
We now need to calculate the Terminal Value, which accounts for all the future cash flows after this ten year period. The Gordon Growth formula is used to calculate Terminal Value at a future annual growth rate equal to the 5-year average of the 10-year government bond yield of 2.9%. We discount the terminal cash flows to today's value at a cost of equity of 6.8%.
Terminal Value (TV)= FCF2034 × (1 + g) ÷ (r – g) = CN¥5.8b× (1 + 2.9%) ÷ (6.8%– 2.9%) = CN¥151b
Present Value of Terminal Value (PVTV)= TV / (1 + r)10= CN¥151b÷ ( 1 + 6.8%)10= CN¥78b
The total value, or equity value, is then the sum of the present value of the future cash flows, which in this case is CN¥116b. To get the intrinsic value per share, we divide this by the total number of shares outstanding. Relative to the current share price of CN¥23.8, the company appears a touch undervalued at a 29% discount to where the stock price trades currently. Valuations are imprecise instruments though, rather like a telescope - move a few degrees and end up in a different galaxy. Do keep this in mind.
Important Assumptions
We would point out that the most important inputs to a discounted cash flow are the discount rate and of course the actual cash flows. Part of investing is coming up with your own evaluation of a company's future performance, so try the calculation yourself and check your own assumptions. The DCF also does not consider the possible cyclicality of an industry, or a company's future capital requirements, so it does not give a full picture of a company's potential performance. Given that we are looking at Henan Shuanghui Investment & DevelopmentLtd as potential shareholders, the cost of equity is used as the discount rate, rather than the cost of capital (or weighted average cost of capital, WACC) which accounts for debt. In this calculation we've used 6.8%, which is based on a levered beta of 0.800. Beta is a measure of a stock's volatility, compared to the market as a whole. We get our beta from the industry average beta of globally comparable companies, with an imposed limit between 0.8 and 2.0, which is a reasonable range for a stable business.
SWOT Analysis for Henan Shuanghui Investment & DevelopmentLtd
- Debt is not viewed as a risk.
- Dividend is in the top 25% of dividend payers in the market.
- Earnings declined over the past year.
- Annual earnings are forecast to grow for the next 3 years.
- Good value based on P/E ratio and estimated fair value.
- Dividends are not covered by cash flow.
- Annual earnings are forecast to grow slower than the Chinese market.
Next Steps:
Valuation is only one side of the coin in terms of building your investment thesis, and it is only one of many factors that you need to assess for a company. It's not possible to obtain a foolproof valuation with a DCF model. Rather it should be seen as a guide to "what assumptions need to be true for this stock to be under/overvalued?" For example, changes in the company's cost of equity or the risk free rate can significantly impact the valuation. Can we work out why the company is trading at a discount to intrinsic value? For Henan Shuanghui Investment & DevelopmentLtd, we've put together three further factors you should consider:
- Risks: As an example, we've found 1 warning sign for Henan Shuanghui Investment & DevelopmentLtd that you need to consider before investing here.
- Future Earnings: How does 000895's growth rate compare to its peers and the wider market? Dig deeper into the analyst consensus number for the upcoming years by interacting with our free analyst growth expectation chart.
- Other High Quality Alternatives: Do you like a good all-rounder? Explore our interactive list of high quality stocks to get an idea of what else is out there you may be missing!
PS. The Simply Wall St app conducts a discounted cash flow valuation for every stock on the SZSE every day. If you want to find the calculation for other stocks just search here.
Valuation is complex, but we're here to simplify it.
Discover if Henan Shuanghui Investment & DevelopmentLtd might be undervalued or overvalued with our detailed analysis, featuring fair value estimates, potential risks, dividends, insider trades, and its financial condition.
Access Free AnalysisHave feedback on this article? Concerned about the content? Get in touch with us directly. Alternatively, email editorial-team (at) simplywallst.com.
This article by Simply Wall St is general in nature. We provide commentary based on historical data and analyst forecasts only using an unbiased methodology and our articles are not intended to be financial advice. It does not constitute a recommendation to buy or sell any stock, and does not take account of your objectives, or your financial situation. We aim to bring you long-term focused analysis driven by fundamental data. Note that our analysis may not factor in the latest price-sensitive company announcements or qualitative material. Simply Wall St has no position in any stocks mentioned.
About SZSE:000895
Henan Shuanghui Investment & DevelopmentLtd
Henan Shuanghui Investment & Development Co.,Ltd.
Undervalued with excellent balance sheet and pays a dividend.
Similar Companies
Market Insights

Community Narratives


