Yunnan Shennong Agricultural Industry Group Co.,LTD.'s (SHSE:605296) 26% Jump Shows Its Popularity With Investors


Yunnan Shennong Agricultural Industry Group Co.,LTD. (SHSE:605296) shareholders would be excited to see that the share price has had a great month, posting a 26% gain and recovering from prior weakness. The last 30 days bring the annual gain to a very sharp 41%.
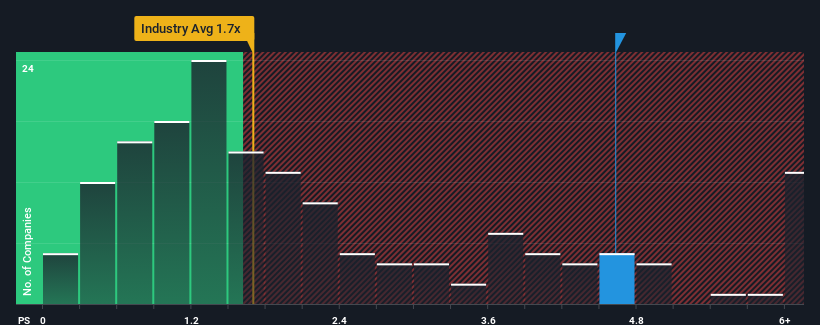
After such a large jump in price, you could be forgiven for thinking Yunnan Shennong Agricultural Industry GroupLTD is a stock to steer clear of with a price-to-sales ratios (or "P/S") of 4.6x, considering almost half the companies in China's Food industry have P/S ratios below 1.7x. Although, it's not wise to just take the P/S at face value as there may be an explanation why it's so lofty.
See our latest analysis for Yunnan Shennong Agricultural Industry GroupLTD
How Yunnan Shennong Agricultural Industry GroupLTD Has Been Performing
Yunnan Shennong Agricultural Industry GroupLTD certainly has been doing a good job lately as it's been growing revenue more than most other companies. It seems that many are expecting the strong revenue performance to persist, which has raised the P/S. You'd really hope so, otherwise you're paying a pretty hefty price for no particular reason.
Want the full picture on analyst estimates for the company? Then our free report on Yunnan Shennong Agricultural Industry GroupLTD will help you uncover what's on the horizon.Do Revenue Forecasts Match The High P/S Ratio?
Yunnan Shennong Agricultural Industry GroupLTD's P/S ratio would be typical for a company that's expected to deliver very strong growth, and importantly, perform much better than the industry.
Taking a look back first, we see that the company grew revenue by an impressive 56% last year. The strong recent performance means it was also able to grow revenue by 51% in total over the last three years. Therefore, it's fair to say the revenue growth recently has been superb for the company.
Shifting to the future, estimates from the five analysts covering the company suggest revenue should grow by 41% over the next year. Meanwhile, the rest of the industry is forecast to only expand by 15%, which is noticeably less attractive.
With this in mind, it's not hard to understand why Yunnan Shennong Agricultural Industry GroupLTD's P/S is high relative to its industry peers. Apparently shareholders aren't keen to offload something that is potentially eyeing a more prosperous future.
What We Can Learn From Yunnan Shennong Agricultural Industry GroupLTD's P/S?
Shares in Yunnan Shennong Agricultural Industry GroupLTD have seen a strong upwards swing lately, which has really helped boost its P/S figure. We'd say the price-to-sales ratio's power isn't primarily as a valuation instrument but rather to gauge current investor sentiment and future expectations.
Our look into Yunnan Shennong Agricultural Industry GroupLTD shows that its P/S ratio remains high on the merit of its strong future revenues. At this stage investors feel the potential for a deterioration in revenues is quite remote, justifying the elevated P/S ratio. Unless the analysts have really missed the mark, these strong revenue forecasts should keep the share price buoyant.
Before you settle on your opinion, we've discovered 3 warning signs for Yunnan Shennong Agricultural Industry GroupLTD (1 shouldn't be ignored!) that you should be aware of.
If strong companies turning a profit tickle your fancy, then you'll want to check out this free list of interesting companies that trade on a low P/E (but have proven they can grow earnings).
If you're looking to trade Yunnan Shennong Agricultural Industry GroupLTD, open an account with the lowest-cost platform trusted by professionals, Interactive Brokers.
With clients in over 200 countries and territories, and access to 160 markets, IBKR lets you trade stocks, options, futures, forex, bonds and funds from a single integrated account.
Enjoy no hidden fees, no account minimums, and FX conversion rates as low as 0.03%, far better than what most brokers offer.
Sponsored ContentNew: Manage All Your Stock Portfolios in One Place
We've created the ultimate portfolio companion for stock investors, and it's free.
• Connect an unlimited number of Portfolios and see your total in one currency
• Be alerted to new Warning Signs or Risks via email or mobile
• Track the Fair Value of your stocks
Have feedback on this article? Concerned about the content? Get in touch with us directly. Alternatively, email editorial-team (at) simplywallst.com.
This article by Simply Wall St is general in nature. We provide commentary based on historical data and analyst forecasts only using an unbiased methodology and our articles are not intended to be financial advice. It does not constitute a recommendation to buy or sell any stock, and does not take account of your objectives, or your financial situation. We aim to bring you long-term focused analysis driven by fundamental data. Note that our analysis may not factor in the latest price-sensitive company announcements or qualitative material. Simply Wall St has no position in any stocks mentioned.
About SHSE:605296
Yunnan Shennong Agricultural Industry GroupLTD
Yunnan Shennong Agricultural Industry Group Co.,LTD.
Excellent balance sheet and good value.
Market Insights

Community Narratives

