A Look At The Fair Value Of Jonjee Hi-Tech Industrial and Commercial Holding Co.,Ltd (SHSE:600872)


Key Insights
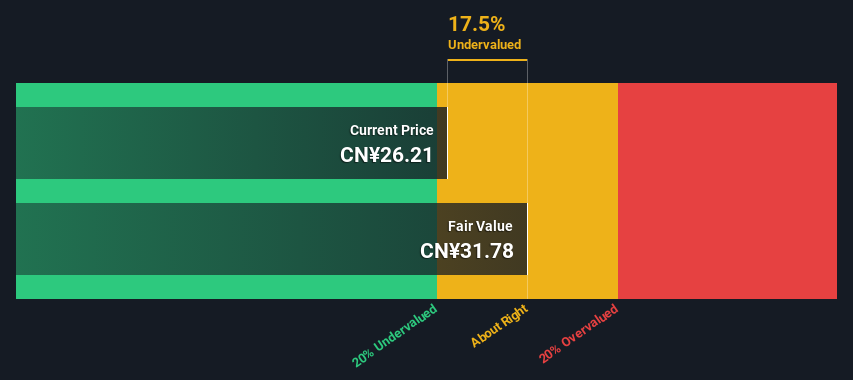
- The projected fair value for Jonjee Hi-Tech Industrial and Commercial HoldingLtd is CN¥31.78 based on 2 Stage Free Cash Flow to Equity
- Current share price of CN¥26.21 suggests Jonjee Hi-Tech Industrial and Commercial HoldingLtd is potentially trading close to its fair value
- Our fair value estimate is 8.0% lower than Jonjee Hi-Tech Industrial and Commercial HoldingLtd's analyst price target of CN¥34.54
How far off is Jonjee Hi-Tech Industrial and Commercial Holding Co.,Ltd (SHSE:600872) from its intrinsic value? Using the most recent financial data, we'll take a look at whether the stock is fairly priced by taking the forecast future cash flows of the company and discounting them back to today's value. Our analysis will employ the Discounted Cash Flow (DCF) model. Models like these may appear beyond the comprehension of a lay person, but they're fairly easy to follow.
Remember though, that there are many ways to estimate a company's value, and a DCF is just one method. For those who are keen learners of equity analysis, the Simply Wall St analysis model here may be something of interest to you.
View our latest analysis for Jonjee Hi-Tech Industrial and Commercial HoldingLtd
What's The Estimated Valuation?
We use what is known as a 2-stage model, which simply means we have two different periods of growth rates for the company's cash flows. Generally the first stage is higher growth, and the second stage is a lower growth phase. In the first stage we need to estimate the cash flows to the business over the next ten years. Where possible we use analyst estimates, but when these aren't available we extrapolate the previous free cash flow (FCF) from the last estimate or reported value. We assume companies with shrinking free cash flow will slow their rate of shrinkage, and that companies with growing free cash flow will see their growth rate slow, over this period. We do this to reflect that growth tends to slow more in the early years than it does in later years.
A DCF is all about the idea that a dollar in the future is less valuable than a dollar today, and so the sum of these future cash flows is then discounted to today's value:
10-year free cash flow (FCF) forecast
| 2024 | 2025 | 2026 | 2027 | 2028 | 2029 | 2030 | 2031 | 2032 | 2033 | |
| Levered FCF (CN¥, Millions) | CN¥773.0m | CN¥799.0m | CN¥1.01b | CN¥1.10b | CN¥1.18b | CN¥1.26b | CN¥1.32b | CN¥1.38b | CN¥1.43b | CN¥1.49b |
| Growth Rate Estimate Source | Analyst x2 | Analyst x2 | Analyst x2 | Est @ 9.28% | Est @ 7.36% | Est @ 6.03% | Est @ 5.09% | Est @ 4.43% | Est @ 3.97% | Est @ 3.65% |
| Present Value (CN¥, Millions) Discounted @ 7.4% | CN¥720 | CN¥693 | CN¥815 | CN¥829 | CN¥829 | CN¥818 | CN¥800 | CN¥778 | CN¥753 | CN¥727 |
("Est" = FCF growth rate estimated by Simply Wall St)
Present Value of 10-year Cash Flow (PVCF) = CN¥7.8b
After calculating the present value of future cash flows in the initial 10-year period, we need to calculate the Terminal Value, which accounts for all future cash flows beyond the first stage. For a number of reasons a very conservative growth rate is used that cannot exceed that of a country's GDP growth. In this case we have used the 5-year average of the 10-year government bond yield (2.9%) to estimate future growth. In the same way as with the 10-year 'growth' period, we discount future cash flows to today's value, using a cost of equity of 7.4%.
Terminal Value (TV)= FCF2033 × (1 + g) ÷ (r – g) = CN¥1.5b× (1 + 2.9%) ÷ (7.4%– 2.9%) = CN¥34b
Present Value of Terminal Value (PVTV)= TV / (1 + r)10= CN¥34b÷ ( 1 + 7.4%)10= CN¥17b
The total value is the sum of cash flows for the next ten years plus the discounted terminal value, which results in the Total Equity Value, which in this case is CN¥24b. To get the intrinsic value per share, we divide this by the total number of shares outstanding. Compared to the current share price of CN¥26.2, the company appears about fair value at a 18% discount to where the stock price trades currently. Remember though, that this is just an approximate valuation, and like any complex formula - garbage in, garbage out.
The Assumptions
The calculation above is very dependent on two assumptions. The first is the discount rate and the other is the cash flows. You don't have to agree with these inputs, I recommend redoing the calculations yourself and playing with them. The DCF also does not consider the possible cyclicality of an industry, or a company's future capital requirements, so it does not give a full picture of a company's potential performance. Given that we are looking at Jonjee Hi-Tech Industrial and Commercial HoldingLtd as potential shareholders, the cost of equity is used as the discount rate, rather than the cost of capital (or weighted average cost of capital, WACC) which accounts for debt. In this calculation we've used 7.4%, which is based on a levered beta of 0.800. Beta is a measure of a stock's volatility, compared to the market as a whole. We get our beta from the industry average beta of globally comparable companies, with an imposed limit between 0.8 and 2.0, which is a reasonable range for a stable business.
SWOT Analysis for Jonjee Hi-Tech Industrial and Commercial HoldingLtd
- Debt is not viewed as a risk.
- Dividends are covered by earnings and cash flows.
- Dividend is low compared to the top 25% of dividend payers in the Food market.
- Annual revenue is forecast to grow faster than the Chinese market.
- Current share price is below our estimate of fair value.
- Annual earnings are forecast to decline for the next 3 years.
Moving On:
Valuation is only one side of the coin in terms of building your investment thesis, and it shouldn't be the only metric you look at when researching a company. The DCF model is not a perfect stock valuation tool. Rather it should be seen as a guide to "what assumptions need to be true for this stock to be under/overvalued?" For instance, if the terminal value growth rate is adjusted slightly, it can dramatically alter the overall result. For Jonjee Hi-Tech Industrial and Commercial HoldingLtd, there are three additional aspects you should consider:
- Risks: For instance, we've identified 3 warning signs for Jonjee Hi-Tech Industrial and Commercial HoldingLtd (2 are significant) you should be aware of.
- Future Earnings: How does 600872's growth rate compare to its peers and the wider market? Dig deeper into the analyst consensus number for the upcoming years by interacting with our free analyst growth expectation chart.
- Other Solid Businesses: Low debt, high returns on equity and good past performance are fundamental to a strong business. Why not explore our interactive list of stocks with solid business fundamentals to see if there are other companies you may not have considered!
PS. The Simply Wall St app conducts a discounted cash flow valuation for every stock on the SHSE every day. If you want to find the calculation for other stocks just search here.
New: Manage All Your Stock Portfolios in One Place
We've created the ultimate portfolio companion for stock investors, and it's free.
• Connect an unlimited number of Portfolios and see your total in one currency
• Be alerted to new Warning Signs or Risks via email or mobile
• Track the Fair Value of your stocks
Have feedback on this article? Concerned about the content? Get in touch with us directly. Alternatively, email editorial-team (at) simplywallst.com.
This article by Simply Wall St is general in nature. We provide commentary based on historical data and analyst forecasts only using an unbiased methodology and our articles are not intended to be financial advice. It does not constitute a recommendation to buy or sell any stock, and does not take account of your objectives, or your financial situation. We aim to bring you long-term focused analysis driven by fundamental data. Note that our analysis may not factor in the latest price-sensitive company announcements or qualitative material. Simply Wall St has no position in any stocks mentioned.
About SHSE:600872
Jonjee Hi-Tech Industrial and Commercial HoldingLtd
Produces and sells seasoning products in China and internationally.
Flawless balance sheet, undervalued and pays a dividend.
Market Insights

Community Narratives

