
The external fund manager backed by Berkshire Hathaway's Charlie Munger, Li Lu, makes no bones about it when he says 'The biggest investment risk is not the volatility of prices, but whether you will suffer a permanent loss of capital.' It's only natural to consider a company's balance sheet when you examine how risky it is, since debt is often involved when a business collapses. Importantly, Henan Dayou Energy Co., Ltd (SHSE:600403) does carry debt. But should shareholders be worried about its use of debt?
What Risk Does Debt Bring?
Debt is a tool to help businesses grow, but if a business is incapable of paying off its lenders, then it exists at their mercy. Part and parcel of capitalism is the process of 'creative destruction' where failed businesses are mercilessly liquidated by their bankers. However, a more common (but still painful) scenario is that it has to raise new equity capital at a low price, thus permanently diluting shareholders. Of course, the upside of debt is that it often represents cheap capital, especially when it replaces dilution in a company with the ability to reinvest at high rates of return. When we examine debt levels, we first consider both cash and debt levels, together.
See our latest analysis for Henan Dayou Energy
What Is Henan Dayou Energy's Debt?
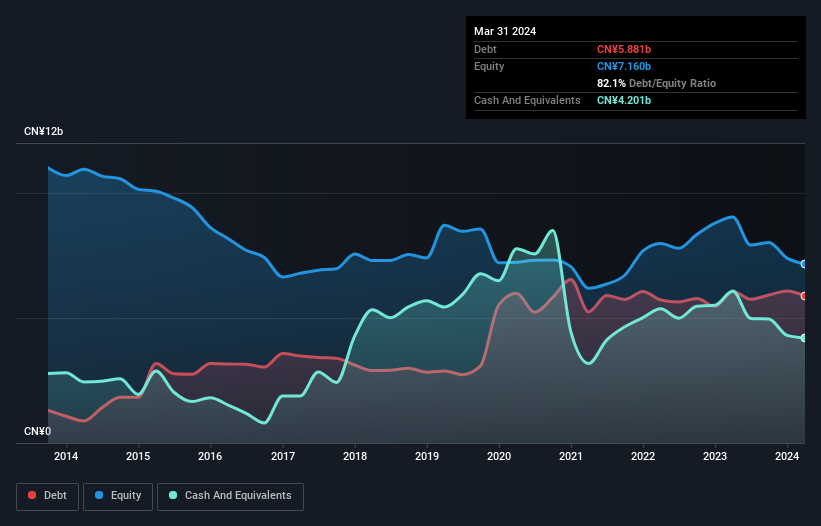
The chart below, which you can click on for greater detail, shows that Henan Dayou Energy had CN¥5.88b in debt in March 2024; about the same as the year before. However, it also had CN¥4.20b in cash, and so its net debt is CN¥1.68b.
How Strong Is Henan Dayou Energy's Balance Sheet?
The latest balance sheet data shows that Henan Dayou Energy had liabilities of CN¥11.7b due within a year, and liabilities of CN¥2.01b falling due after that. Offsetting this, it had CN¥4.20b in cash and CN¥941.6m in receivables that were due within 12 months. So its liabilities total CN¥8.53b more than the combination of its cash and short-term receivables.
The deficiency here weighs heavily on the CN¥5.67b company itself, as if a child were struggling under the weight of an enormous back-pack full of books, his sports gear, and a trumpet. So we definitely think shareholders need to watch this one closely. At the end of the day, Henan Dayou Energy would probably need a major re-capitalization if its creditors were to demand repayment. When analysing debt levels, the balance sheet is the obvious place to start. But it is Henan Dayou Energy's earnings that will influence how the balance sheet holds up in the future. So when considering debt, it's definitely worth looking at the earnings trend. Click here for an interactive snapshot.
In the last year Henan Dayou Energy had a loss before interest and tax, and actually shrunk its revenue by 37%, to CN¥5.2b. To be frank that doesn't bode well.
Caveat Emptor
Not only did Henan Dayou Energy's revenue slip over the last twelve months, but it also produced negative earnings before interest and tax (EBIT). Its EBIT loss was a whopping CN¥899m. Considering that alongside the liabilities mentioned above make us nervous about the company. We'd want to see some strong near-term improvements before getting too interested in the stock. Not least because it had negative free cash flow of CN¥760m over the last twelve months. So suffice it to say we consider the stock to be risky. When we look at a riskier company, we like to check how their profits (or losses) are trending over time. Today, we're providing readers this interactive graph showing how Henan Dayou Energy's profit, revenue, and operating cashflow have changed over the last few years.
Of course, if you're the type of investor who prefers buying stocks without the burden of debt, then don't hesitate to discover our exclusive list of net cash growth stocks, today.
If you're looking to trade Henan Dayou Energy, open an account with the lowest-cost platform trusted by professionals, Interactive Brokers.
With clients in over 200 countries and territories, and access to 160 markets, IBKR lets you trade stocks, options, futures, forex, bonds and funds from a single integrated account.
Enjoy no hidden fees, no account minimums, and FX conversion rates as low as 0.03%, far better than what most brokers offer.
Sponsored ContentValuation is complex, but we're here to simplify it.
Discover if Henan Dayou Energy might be undervalued or overvalued with our detailed analysis, featuring fair value estimates, potential risks, dividends, insider trades, and its financial condition.
Access Free AnalysisHave feedback on this article? Concerned about the content? Get in touch with us directly. Alternatively, email editorial-team (at) simplywallst.com.
This article by Simply Wall St is general in nature. We provide commentary based on historical data and analyst forecasts only using an unbiased methodology and our articles are not intended to be financial advice. It does not constitute a recommendation to buy or sell any stock, and does not take account of your objectives, or your financial situation. We aim to bring you long-term focused analysis driven by fundamental data. Note that our analysis may not factor in the latest price-sensitive company announcements or qualitative material. Simply Wall St has no position in any stocks mentioned.
About SHSE:600403
Adequate balance sheet very low.
Market Insights

Community Narratives

