- China
- /
- Capital Markets
- /
- SZSE:000776
GF Securities (SZSE:000776) shareholders have endured a 17% loss from investing in the stock a year ago


Most people feel a little frustrated if a stock they own goes down in price. But often it is not a reflection of the fundamental business performance. The GF Securities Co., Ltd. (SZSE:000776) is down 21% over a year, but the total shareholder return is -17% once you include the dividend. And that total return actually beats the market decline of 17%. Taking the longer term view, the stock fell 19% over the last three years.
Now let's have a look at the company's fundamentals, and see if the long term shareholder return has matched the performance of the underlying business.
View our latest analysis for GF Securities
In his essay The Superinvestors of Graham-and-Doddsville Warren Buffett described how share prices do not always rationally reflect the value of a business. By comparing earnings per share (EPS) and share price changes over time, we can get a feel for how investor attitudes to a company have morphed over time.
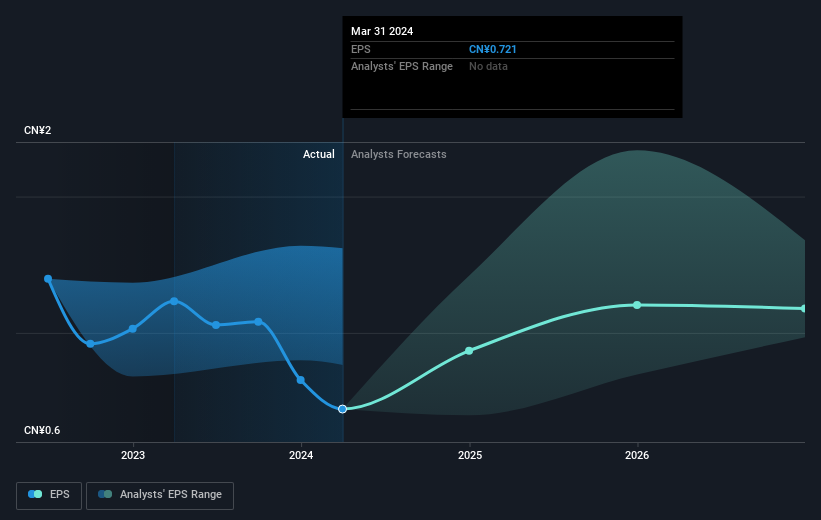
Unhappily, GF Securities had to report a 35% decline in EPS over the last year. This fall in the EPS is significantly worse than the 21% the share price fall. So the market may not be too worried about the EPS figure, at the moment -- or it may have expected earnings to drop faster.
The graphic below depicts how EPS has changed over time (unveil the exact values by clicking on the image).
This free interactive report on GF Securities' earnings, revenue and cash flow is a great place to start, if you want to investigate the stock further.
What About Dividends?
It is important to consider the total shareholder return, as well as the share price return, for any given stock. Whereas the share price return only reflects the change in the share price, the TSR includes the value of dividends (assuming they were reinvested) and the benefit of any discounted capital raising or spin-off. Arguably, the TSR gives a more comprehensive picture of the return generated by a stock. In the case of GF Securities, it has a TSR of -17% for the last 1 year. That exceeds its share price return that we previously mentioned. And there's no prize for guessing that the dividend payments largely explain the divergence!
A Different Perspective
The total return of 17% received by GF Securities shareholders over the last year isn't far from the market return of -17%. So last year was actually even worse than the last five years, which cost shareholders 0.4% per year. Weak performance over the long term usually destroys market confidence in a stock, but bargain hunters may want to take a closer look for signs of a turnaround. I find it very interesting to look at share price over the long term as a proxy for business performance. But to truly gain insight, we need to consider other information, too. For example, we've discovered 1 warning sign for GF Securities that you should be aware of before investing here.
If you like to buy stocks alongside management, then you might just love this free list of companies. (Hint: many of them are unnoticed AND have attractive valuation).
Please note, the market returns quoted in this article reflect the market weighted average returns of stocks that currently trade on Chinese exchanges.
New: Manage All Your Stock Portfolios in One Place
We've created the ultimate portfolio companion for stock investors, and it's free.
• Connect an unlimited number of Portfolios and see your total in one currency
• Be alerted to new Warning Signs or Risks via email or mobile
• Track the Fair Value of your stocks
Have feedback on this article? Concerned about the content? Get in touch with us directly. Alternatively, email editorial-team (at) simplywallst.com.
This article by Simply Wall St is general in nature. We provide commentary based on historical data and analyst forecasts only using an unbiased methodology and our articles are not intended to be financial advice. It does not constitute a recommendation to buy or sell any stock, and does not take account of your objectives, or your financial situation. We aim to bring you long-term focused analysis driven by fundamental data. Note that our analysis may not factor in the latest price-sensitive company announcements or qualitative material. Simply Wall St has no position in any stocks mentioned.
Have feedback on this article? Concerned about the content? Get in touch with us directly. Alternatively, email editorial-team@simplywallst.com
About SZSE:000776
GF Securities
Engages in the provision of capital market services for enterprises, individuals, institutional investors, financial institutions, and government clients in the People’s Republic of China.
Good value with mediocre balance sheet.
