
Advertisement
- China
- /
- Hospitality
- /
- SHSE:900929
Positive Sentiment Still Eludes Shanghai Jinjiang International Travel Co., Ltd. (SHSE:900929) Following 26% Share Price Slump

Unfortunately for some shareholders, the Shanghai Jinjiang International Travel Co., Ltd. (SHSE:900929) share price has dived 26% in the last thirty days, prolonging recent pain. The drop over the last 30 days has capped off a tough year for shareholders, with the share price down 40% in that time.
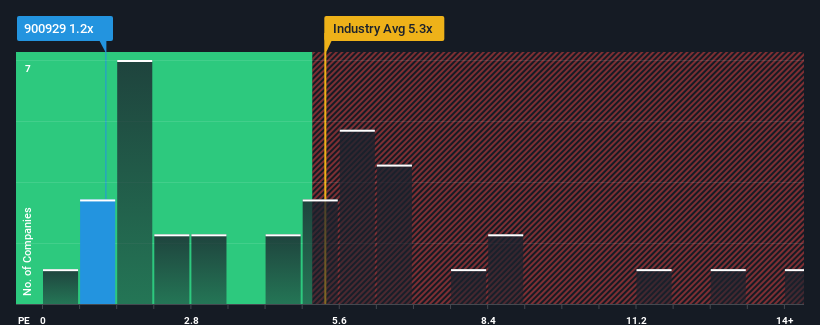
Even after such a large drop in price, considering about half the companies operating in China's Hospitality industry have price-to-sales ratios (or "P/S") above 5.3x, you may still consider Shanghai Jinjiang International Travel as an great investment opportunity with its 1.2x P/S ratio. However, the P/S might be quite low for a reason and it requires further investigation to determine if it's justified.
View our latest analysis for Shanghai Jinjiang International Travel
What Does Shanghai Jinjiang International Travel's P/S Mean For Shareholders?
Recent times have been quite advantageous for Shanghai Jinjiang International Travel as its revenue has been rising very briskly. It might be that many expect the strong revenue performance to degrade substantially, which has repressed the P/S ratio. If you like the company, you'd be hoping this isn't the case so that you could potentially pick up some stock while it's out of favour.
Want the full picture on earnings, revenue and cash flow for the company? Then our free report on Shanghai Jinjiang International Travel will help you shine a light on its historical performance.Do Revenue Forecasts Match The Low P/S Ratio?
In order to justify its P/S ratio, Shanghai Jinjiang International Travel would need to produce anemic growth that's substantially trailing the industry.
If we review the last year of revenue growth, the company posted a terrific increase of 226%. The latest three year period has also seen an excellent 210% overall rise in revenue, aided by its short-term performance. Accordingly, shareholders would have definitely welcomed those medium-term rates of revenue growth.
Comparing that to the industry, which is only predicted to deliver 27% growth in the next 12 months, the company's momentum is stronger based on recent medium-term annualised revenue results.
With this information, we find it odd that Shanghai Jinjiang International Travel is trading at a P/S lower than the industry. It looks like most investors are not convinced the company can maintain its recent growth rates.
What We Can Learn From Shanghai Jinjiang International Travel's P/S?
Shares in Shanghai Jinjiang International Travel have plummeted and its P/S has followed suit. Generally, our preference is to limit the use of the price-to-sales ratio to establishing what the market thinks about the overall health of a company.
Our examination of Shanghai Jinjiang International Travel revealed its three-year revenue trends aren't boosting its P/S anywhere near as much as we would have predicted, given they look better than current industry expectations. When we see robust revenue growth that outpaces the industry, we presume that there are notable underlying risks to the company's future performance, which is exerting downward pressure on the P/S ratio. At least price risks look to be very low if recent medium-term revenue trends continue, but investors seem to think future revenue could see a lot of volatility.
You need to take note of risks, for example - Shanghai Jinjiang International Travel has 3 warning signs (and 1 which can't be ignored) we think you should know about.
Of course, profitable companies with a history of great earnings growth are generally safer bets. So you may wish to see this free collection of other companies that have reasonable P/E ratios and have grown earnings strongly.
New: Manage All Your Stock Portfolios in One Place
We've created the ultimate portfolio companion for stock investors, and it's free.
• Connect an unlimited number of Portfolios and see your total in one currency
• Be alerted to new Warning Signs or Risks via email or mobile
• Track the Fair Value of your stocks
Have feedback on this article? Concerned about the content? Get in touch with us directly. Alternatively, email editorial-team (at) simplywallst.com.
This article by Simply Wall St is general in nature. We provide commentary based on historical data and analyst forecasts only using an unbiased methodology and our articles are not intended to be financial advice. It does not constitute a recommendation to buy or sell any stock, and does not take account of your objectives, or your financial situation. We aim to bring you long-term focused analysis driven by fundamental data. Note that our analysis may not factor in the latest price-sensitive company announcements or qualitative material. Simply Wall St has no position in any stocks mentioned.
About SHSE:900929
Shanghai Jinjiang International Travel
Shanghai Jinjiang International Travel Co., Ltd.
Solid track record with adequate balance sheet.
Market Insights

Advertisement
Community Narratives
Pinterest will surge as advertising innovations ignite revenue growth
Fair Value US$42.63|27.1% undervalued
BR
Community Contributor
Brambles' Revenue Set to Climb 14% with Profit Margins Following
Fair Value AU$21.90|5.9% overvalued
RO
Community Contributor
Challenging Future for STG as Organic Sales Decline by 8.8%
Fair Value DKK 116.13|26.8% undervalued
KA
Community Contributor