
Advertisement
Returns On Capital Signal Tricky Times Ahead For Joy Kie (SZSE:300994)

To find a multi-bagger stock, what are the underlying trends we should look for in a business? Amongst other things, we'll want to see two things; firstly, a growing return on capital employed (ROCE) and secondly, an expansion in the company's amount of capital employed. Ultimately, this demonstrates that it's a business that is reinvesting profits at increasing rates of return. However, after briefly looking over the numbers, we don't think Joy Kie (SZSE:300994) has the makings of a multi-bagger going forward, but let's have a look at why that may be.
What Is Return On Capital Employed (ROCE)?
For those who don't know, ROCE is a measure of a company's yearly pre-tax profit (its return), relative to the capital employed in the business. To calculate this metric for Joy Kie, this is the formula:
Return on Capital Employed = Earnings Before Interest and Tax (EBIT) ÷ (Total Assets - Current Liabilities)
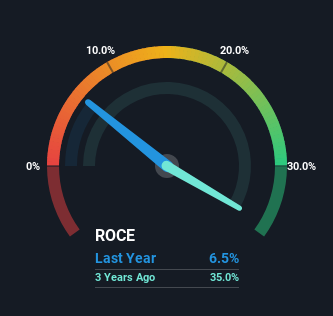
0.065 = CN¥76m ÷ (CN¥1.7b - CN¥575m) (Based on the trailing twelve months to September 2023).
So, Joy Kie has an ROCE of 6.5%. Even though it's in line with the industry average of 6.4%, it's still a low return by itself.
Check out our latest analysis for Joy Kie
Above you can see how the current ROCE for Joy Kie compares to its prior returns on capital, but there's only so much you can tell from the past. If you'd like to see what analysts are forecasting going forward, you should check out our free analyst report for Joy Kie .
What The Trend Of ROCE Can Tell Us
When we looked at the ROCE trend at Joy Kie, we didn't gain much confidence. Around five years ago the returns on capital were 42%, but since then they've fallen to 6.5%. And considering revenue has dropped while employing more capital, we'd be cautious. If this were to continue, you might be looking at a company that is trying to reinvest for growth but is actually losing market share since sales haven't increased.
On a related note, Joy Kie has decreased its current liabilities to 33% of total assets. So we could link some of this to the decrease in ROCE. Effectively this means their suppliers or short-term creditors are funding less of the business, which reduces some elements of risk. Since the business is basically funding more of its operations with it's own money, you could argue this has made the business less efficient at generating ROCE.
What We Can Learn From Joy Kie's ROCE
From the above analysis, we find it rather worrisome that returns on capital and sales for Joy Kie have fallen, meanwhile the business is employing more capital than it was five years ago. It should come as no surprise then that the stock has fallen 44% over the last year, so it looks like investors are recognizing these changes. With underlying trends that aren't great in these areas, we'd consider looking elsewhere.
One final note, you should learn about the 3 warning signs we've spotted with Joy Kie (including 2 which are a bit concerning) .
For those who like to invest in solid companies, check out this free list of companies with solid balance sheets and high returns on equity.
New: Manage All Your Stock Portfolios in One Place
We've created the ultimate portfolio companion for stock investors, and it's free.
• Connect an unlimited number of Portfolios and see your total in one currency
• Be alerted to new Warning Signs or Risks via email or mobile
• Track the Fair Value of your stocks
Have feedback on this article? Concerned about the content? Get in touch with us directly. Alternatively, email editorial-team (at) simplywallst.com.
This article by Simply Wall St is general in nature. We provide commentary based on historical data and analyst forecasts only using an unbiased methodology and our articles are not intended to be financial advice. It does not constitute a recommendation to buy or sell any stock, and does not take account of your objectives, or your financial situation. We aim to bring you long-term focused analysis driven by fundamental data. Note that our analysis may not factor in the latest price-sensitive company announcements or qualitative material. Simply Wall St has no position in any stocks mentioned.
About SZSE:300994
Joy Kie
Engages in the manufacture and sale of bicycle products in China and internationally.
Excellent balance sheet low.
Market Insights

Advertisement
Community Narratives
Groundbreaking therapies that could change the treatment landscape for PTSD, fibromyalgia, MS & Alzheimer’s
Fair Value US$6.20|86.9% undervalued
CM
Community Contributor
DigitalOcean Will Grow 14% by Embracing AI with Paperspace Acquisition
Fair Value US$50.00|42.8% undervalued
NE
Community Contributor
Viant Technology: A Rising AdTech Challenger in the AI-Powered CTV Market
Fair Value US$38.61|66.0% undervalued
BL
Community Contributor
Volvo will Accelerate Forward into Electric and Autonomous Leadership in Five Years
Fair Value SEK 438.80|40.8% undervalued
UN
Community Contributor