
Advertisement
- China
- /
- Consumer Durables
- /
- SZSE:002779
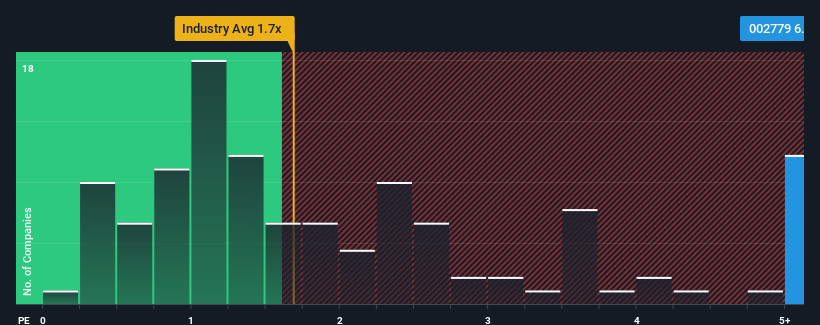
After Leaping 27% Zhejiang Zhongjian Technology Co.,Ltd (SZSE:002779) Shares Are Not Flying Under The Radar
Zhejiang Zhongjian Technology Co.,Ltd (SZSE:002779) shareholders are no doubt pleased to see that the share price has bounced 27% in the last month, although it is still struggling to make up recently lost ground. The last 30 days bring the annual gain to a very sharp 55%.
After such a large jump in price, you could be forgiven for thinking Zhejiang Zhongjian TechnologyLtd is a stock to steer clear of with a price-to-sales ratios (or "P/S") of 6.1x, considering almost half the companies in China's Consumer Durables industry have P/S ratios below 1.7x. Although, it's not wise to just take the P/S at face value as there may be an explanation why it's so lofty.
Check out our latest analysis for Zhejiang Zhongjian TechnologyLtd
What Does Zhejiang Zhongjian TechnologyLtd's P/S Mean For Shareholders?
Zhejiang Zhongjian TechnologyLtd certainly has been doing a great job lately as it's been growing its revenue at a really rapid pace. It seems that many are expecting the strong revenue performance to beat most other companies over the coming period, which has increased investors’ willingness to pay up for the stock. You'd really hope so, otherwise you're paying a pretty hefty price for no particular reason.
Want the full picture on earnings, revenue and cash flow for the company? Then our free report on Zhejiang Zhongjian TechnologyLtd will help you shine a light on its historical performance.Do Revenue Forecasts Match The High P/S Ratio?
The only time you'd be truly comfortable seeing a P/S as steep as Zhejiang Zhongjian TechnologyLtd's is when the company's growth is on track to outshine the industry decidedly.
If we review the last year of revenue growth, the company posted a terrific increase of 31%. The latest three year period has also seen an excellent 72% overall rise in revenue, aided by its short-term performance. Accordingly, shareholders would have definitely welcomed those medium-term rates of revenue growth.
Comparing that to the industry, which is only predicted to deliver 10% growth in the next 12 months, the company's momentum is stronger based on recent medium-term annualised revenue results.
With this in consideration, it's not hard to understand why Zhejiang Zhongjian TechnologyLtd's P/S is high relative to its industry peers. Presumably shareholders aren't keen to offload something they believe will continue to outmanoeuvre the wider industry.
What We Can Learn From Zhejiang Zhongjian TechnologyLtd's P/S?
Zhejiang Zhongjian TechnologyLtd's P/S has grown nicely over the last month thanks to a handy boost in the share price. Using the price-to-sales ratio alone to determine if you should sell your stock isn't sensible, however it can be a practical guide to the company's future prospects.
As we suspected, our examination of Zhejiang Zhongjian TechnologyLtd revealed its three-year revenue trends are contributing to its high P/S, given they look better than current industry expectations. Right now shareholders are comfortable with the P/S as they are quite confident revenue aren't under threat. Unless the recent medium-term conditions change, they will continue to provide strong support to the share price.
The company's balance sheet is another key area for risk analysis. You can assess many of the main risks through our free balance sheet analysis for Zhejiang Zhongjian TechnologyLtd with six simple checks.
Of course, profitable companies with a history of great earnings growth are generally safer bets. So you may wish to see this free collection of other companies that have reasonable P/E ratios and have grown earnings strongly.
Valuation is complex, but we're here to simplify it.
Discover if Zhejiang Zhongjian TechnologyLtd might be undervalued or overvalued with our detailed analysis, featuring fair value estimates, potential risks, dividends, insider trades, and its financial condition.
Access Free AnalysisHave feedback on this article? Concerned about the content? Get in touch with us directly. Alternatively, email editorial-team (at) simplywallst.com.
This article by Simply Wall St is general in nature. We provide commentary based on historical data and analyst forecasts only using an unbiased methodology and our articles are not intended to be financial advice. It does not constitute a recommendation to buy or sell any stock, and does not take account of your objectives, or your financial situation. We aim to bring you long-term focused analysis driven by fundamental data. Note that our analysis may not factor in the latest price-sensitive company announcements or qualitative material. Simply Wall St has no position in any stocks mentioned.
About SZSE:002779
Zhejiang Zhongjian TechnologyLtd
Engages in the research and development, production, and sale of various garden machinery products in China and internationally.
Adequate balance sheet with moderate growth potential.
Market Insights

Advertisement
Community Narratives
Kodiak AI - a potential 100 bagger opportunity?
Fair Value US$14.00|41.9% undervalued
DA
Community Contributor
A Fair Price for a Great Business Facing Real Threats
Fair Value US$383.06|14.1% undervalued
IM
Community Contributor
AXON And Shopify Integration Will Unlock Global Mobile Advertising
Fair Value US$613.59|1.3% undervalued
AN
Based on Analyst Price Targets