Zhejiang Busen Garments Co., Ltd.'s (SZSE:002569) 28% Price Boost Is Out Of Tune With Revenues


Those holding Zhejiang Busen Garments Co., Ltd. (SZSE:002569) shares would be relieved that the share price has rebounded 28% in the last thirty days, but it needs to keep going to repair the recent damage it has caused to investor portfolios. But the gains over the last month weren't enough to make shareholders whole, as the share price is still down 8.0% in the last twelve months.
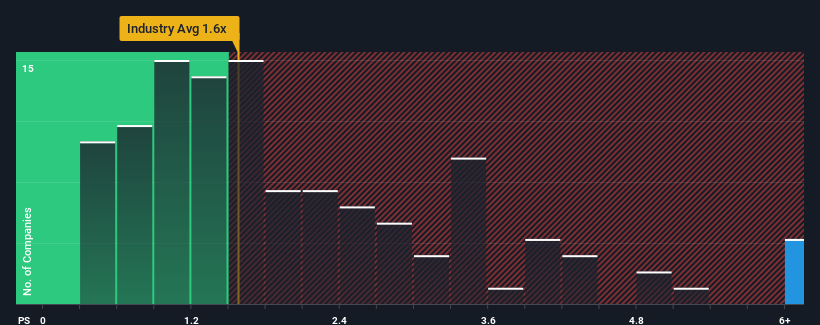
Since its price has surged higher, given around half the companies in China's Luxury industry have price-to-sales ratios (or "P/S") below 1.6x, you may consider Zhejiang Busen Garments as a stock to avoid entirely with its 7x P/S ratio. Nonetheless, we'd need to dig a little deeper to determine if there is a rational basis for the highly elevated P/S.
Check out our latest analysis for Zhejiang Busen Garments
How Has Zhejiang Busen Garments Performed Recently?
For example, consider that Zhejiang Busen Garments' financial performance has been poor lately as its revenue has been in decline. Perhaps the market believes the company can do enough to outperform the rest of the industry in the near future, which is keeping the P/S ratio high. However, if this isn't the case, investors might get caught out paying too much for the stock.
Want the full picture on earnings, revenue and cash flow for the company? Then our free report on Zhejiang Busen Garments will help you shine a light on its historical performance.Do Revenue Forecasts Match The High P/S Ratio?
The only time you'd be truly comfortable seeing a P/S as steep as Zhejiang Busen Garments' is when the company's growth is on track to outshine the industry decidedly.
In reviewing the last year of financials, we were disheartened to see the company's revenues fell to the tune of 36%. This means it has also seen a slide in revenue over the longer-term as revenue is down 52% in total over the last three years. So unfortunately, we have to acknowledge that the company has not done a great job of growing revenue over that time.
Weighing that medium-term revenue trajectory against the broader industry's one-year forecast for expansion of 20% shows it's an unpleasant look.
With this in mind, we find it worrying that Zhejiang Busen Garments' P/S exceeds that of its industry peers. Apparently many investors in the company are way more bullish than recent times would indicate and aren't willing to let go of their stock at any price. Only the boldest would assume these prices are sustainable as a continuation of recent revenue trends is likely to weigh heavily on the share price eventually.
The Final Word
Shares in Zhejiang Busen Garments have seen a strong upwards swing lately, which has really helped boost its P/S figure. Using the price-to-sales ratio alone to determine if you should sell your stock isn't sensible, however it can be a practical guide to the company's future prospects.
We've established that Zhejiang Busen Garments currently trades on a much higher than expected P/S since its recent revenues have been in decline over the medium-term. With a revenue decline on investors' minds, the likelihood of a souring sentiment is quite high which could send the P/S back in line with what we'd expect. If recent medium-term revenue trends continue, it will place shareholders' investments at significant risk and potential investors in danger of paying an excessive premium.
Before you settle on your opinion, we've discovered 1 warning sign for Zhejiang Busen Garments that you should be aware of.
If these risks are making you reconsider your opinion on Zhejiang Busen Garments, explore our interactive list of high quality stocks to get an idea of what else is out there.
If you're looking to trade Zhejiang Busen Garments, open an account with the lowest-cost platform trusted by professionals, Interactive Brokers.
With clients in over 200 countries and territories, and access to 160 markets, IBKR lets you trade stocks, options, futures, forex, bonds and funds from a single integrated account.
Enjoy no hidden fees, no account minimums, and FX conversion rates as low as 0.03%, far better than what most brokers offer.
Sponsored ContentValuation is complex, but we're here to simplify it.
Discover if Zhejiang Busen Garments might be undervalued or overvalued with our detailed analysis, featuring fair value estimates, potential risks, dividends, insider trades, and its financial condition.
Access Free AnalysisHave feedback on this article? Concerned about the content? Get in touch with us directly. Alternatively, email editorial-team (at) simplywallst.com.
This article by Simply Wall St is general in nature. We provide commentary based on historical data and analyst forecasts only using an unbiased methodology and our articles are not intended to be financial advice. It does not constitute a recommendation to buy or sell any stock, and does not take account of your objectives, or your financial situation. We aim to bring you long-term focused analysis driven by fundamental data. Note that our analysis may not factor in the latest price-sensitive company announcements or qualitative material. Simply Wall St has no position in any stocks mentioned.
About SZSE:002569
Zhejiang Busen Garments
Engages in the design, production, and sales of men's brand clothing in China and internationally.
Excellent balance sheet minimal.
Market Insights

Community Narratives

