Anhui Huamao Textile Co., Ltd.'s (SZSE:000850) Shares Climb 30% But Its Business Is Yet to Catch Up


The Anhui Huamao Textile Co., Ltd. (SZSE:000850) share price has done very well over the last month, posting an excellent gain of 30%. Notwithstanding the latest gain, the annual share price return of 3.7% isn't as impressive.
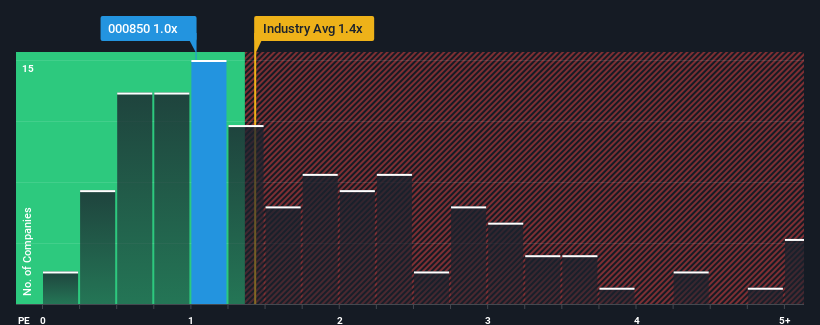
In spite of the firm bounce in price, it's still not a stretch to say that Anhui Huamao Textile's price-to-sales (or "P/S") ratio of 1x right now seems quite "middle-of-the-road" compared to the Luxury industry in China, where the median P/S ratio is around 1.4x. Although, it's not wise to simply ignore the P/S without explanation as investors may be disregarding a distinct opportunity or a costly mistake.
View our latest analysis for Anhui Huamao Textile
What Does Anhui Huamao Textile's P/S Mean For Shareholders?
Anhui Huamao Textile has been doing a decent job lately as it's been growing revenue at a reasonable pace. It might be that many expect the respectable revenue performance to only match most other companies over the coming period, which has kept the P/S from rising. Those who are bullish on Anhui Huamao Textile will be hoping that this isn't the case, so that they can pick up the stock at a lower valuation.
Want the full picture on earnings, revenue and cash flow for the company? Then our free report on Anhui Huamao Textile will help you shine a light on its historical performance.How Is Anhui Huamao Textile's Revenue Growth Trending?
Anhui Huamao Textile's P/S ratio would be typical for a company that's only expected to deliver moderate growth, and importantly, perform in line with the industry.
Taking a look back first, we see that the company managed to grow revenues by a handy 4.0% last year. Still, revenue has barely risen at all in aggregate from three years ago, which is not ideal. Accordingly, shareholders probably wouldn't have been overly satisfied with the unstable medium-term growth rates.
Comparing the recent medium-term revenue trends against the industry's one-year growth forecast of 14% shows it's noticeably less attractive.
In light of this, it's curious that Anhui Huamao Textile's P/S sits in line with the majority of other companies. It seems most investors are ignoring the fairly limited recent growth rates and are willing to pay up for exposure to the stock. They may be setting themselves up for future disappointment if the P/S falls to levels more in line with recent growth rates.
What We Can Learn From Anhui Huamao Textile's P/S?
Anhui Huamao Textile appears to be back in favour with a solid price jump bringing its P/S back in line with other companies in the industry Using the price-to-sales ratio alone to determine if you should sell your stock isn't sensible, however it can be a practical guide to the company's future prospects.
Our examination of Anhui Huamao Textile revealed its poor three-year revenue trends aren't resulting in a lower P/S as per our expectations, given they look worse than current industry outlook. When we see weak revenue with slower than industry growth, we suspect the share price is at risk of declining, bringing the P/S back in line with expectations. Unless the recent medium-term conditions improve, it's hard to accept the current share price as fair value.
Before you take the next step, you should know about the 3 warning signs for Anhui Huamao Textile (2 are significant!) that we have uncovered.
If you're unsure about the strength of Anhui Huamao Textile's business, why not explore our interactive list of stocks with solid business fundamentals for some other companies you may have missed.
If you're looking to trade Anhui Huamao Textile, open an account with the lowest-cost platform trusted by professionals, Interactive Brokers.
With clients in over 200 countries and territories, and access to 160 markets, IBKR lets you trade stocks, options, futures, forex, bonds and funds from a single integrated account.
Enjoy no hidden fees, no account minimums, and FX conversion rates as low as 0.03%, far better than what most brokers offer.
Sponsored ContentNew: Manage All Your Stock Portfolios in One Place
We've created the ultimate portfolio companion for stock investors, and it's free.
• Connect an unlimited number of Portfolios and see your total in one currency
• Be alerted to new Warning Signs or Risks via email or mobile
• Track the Fair Value of your stocks
Have feedback on this article? Concerned about the content? Get in touch with us directly. Alternatively, email editorial-team (at) simplywallst.com.
This article by Simply Wall St is general in nature. We provide commentary based on historical data and analyst forecasts only using an unbiased methodology and our articles are not intended to be financial advice. It does not constitute a recommendation to buy or sell any stock, and does not take account of your objectives, or your financial situation. We aim to bring you long-term focused analysis driven by fundamental data. Note that our analysis may not factor in the latest price-sensitive company announcements or qualitative material. Simply Wall St has no position in any stocks mentioned.
About SZSE:000850
Excellent balance sheet with proven track record and pays a dividend.
Market Insights

Community Narratives

