- China
- /
- Consumer Durables
- /
- SHSE:600690
Haier Smart Home Co., Ltd.'s (SHSE:600690) Intrinsic Value Is Potentially 66% Above Its Share Price

Key Insights
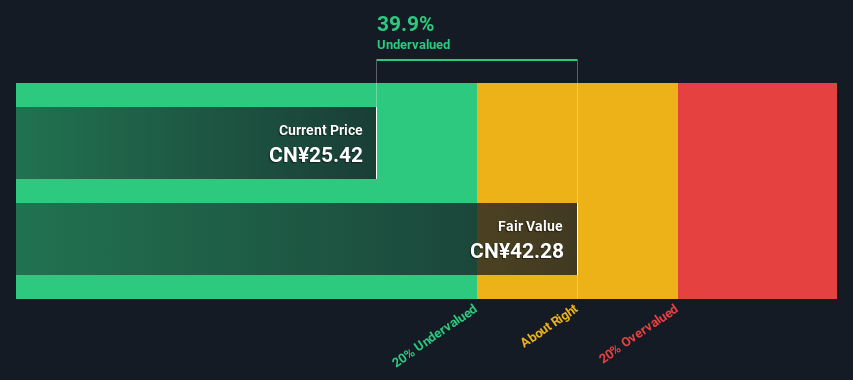
- Using the 2 Stage Free Cash Flow to Equity, Haier Smart Home fair value estimate is CN¥42.28
- Current share price of CN¥25.42 suggests Haier Smart Home is potentially 40% undervalued
- Our fair value estimate is 25% higher than Haier Smart Home's analyst price target of CN¥33.90
Today we'll do a simple run through of a valuation method used to estimate the attractiveness of Haier Smart Home Co., Ltd. (SHSE:600690) as an investment opportunity by projecting its future cash flows and then discounting them to today's value. The Discounted Cash Flow (DCF) model is the tool we will apply to do this. There's really not all that much to it, even though it might appear quite complex.
Companies can be valued in a lot of ways, so we would point out that a DCF is not perfect for every situation. For those who are keen learners of equity analysis, the Simply Wall St analysis model here may be something of interest to you.
View our latest analysis for Haier Smart Home
The Calculation
We are going to use a two-stage DCF model, which, as the name states, takes into account two stages of growth. The first stage is generally a higher growth period which levels off heading towards the terminal value, captured in the second 'steady growth' period. To begin with, we have to get estimates of the next ten years of cash flows. Where possible we use analyst estimates, but when these aren't available we extrapolate the previous free cash flow (FCF) from the last estimate or reported value. We assume companies with shrinking free cash flow will slow their rate of shrinkage, and that companies with growing free cash flow will see their growth rate slow, over this period. We do this to reflect that growth tends to slow more in the early years than it does in later years.
A DCF is all about the idea that a dollar in the future is less valuable than a dollar today, so we need to discount the sum of these future cash flows to arrive at a present value estimate:
10-year free cash flow (FCF) forecast
| 2025 | 2026 | 2027 | 2028 | 2029 | 2030 | 2031 | 2032 | 2033 | 2034 | |
| Levered FCF (CN¥, Millions) | CN¥21.7b | CN¥24.1b | CN¥25.9b | CN¥27.6b | CN¥29.0b | CN¥30.3b | CN¥31.5b | CN¥32.7b | CN¥33.8b | CN¥34.9b |
| Growth Rate Estimate Source | Analyst x6 | Analyst x6 | Est @ 7.68% | Est @ 6.23% | Est @ 5.22% | Est @ 4.51% | Est @ 4.01% | Est @ 3.66% | Est @ 3.42% | Est @ 3.25% |
| Present Value (CN¥, Millions) Discounted @ 9.6% | CN¥19.8k | CN¥20.1k | CN¥19.7k | CN¥19.1k | CN¥18.4k | CN¥17.5k | CN¥16.6k | CN¥15.8k | CN¥14.9k | CN¥14.0k |
("Est" = FCF growth rate estimated by Simply Wall St)
Present Value of 10-year Cash Flow (PVCF) = CN¥176b
The second stage is also known as Terminal Value, this is the business's cash flow after the first stage. The Gordon Growth formula is used to calculate Terminal Value at a future annual growth rate equal to the 5-year average of the 10-year government bond yield of 2.9%. We discount the terminal cash flows to today's value at a cost of equity of 9.6%.
Terminal Value (TV)= FCF2034 × (1 + g) ÷ (r – g) = CN¥35b× (1 + 2.9%) ÷ (9.6%– 2.9%) = CN¥535b
Present Value of Terminal Value (PVTV)= TV / (1 + r)10= CN¥535b÷ ( 1 + 9.6%)10= CN¥215b
The total value, or equity value, is then the sum of the present value of the future cash flows, which in this case is CN¥391b. In the final step we divide the equity value by the number of shares outstanding. Relative to the current share price of CN¥25.4, the company appears quite good value at a 40% discount to where the stock price trades currently. Valuations are imprecise instruments though, rather like a telescope - move a few degrees and end up in a different galaxy. Do keep this in mind.
The Assumptions
Now the most important inputs to a discounted cash flow are the discount rate, and of course, the actual cash flows. You don't have to agree with these inputs, I recommend redoing the calculations yourself and playing with them. The DCF also does not consider the possible cyclicality of an industry, or a company's future capital requirements, so it does not give a full picture of a company's potential performance. Given that we are looking at Haier Smart Home as potential shareholders, the cost of equity is used as the discount rate, rather than the cost of capital (or weighted average cost of capital, WACC) which accounts for debt. In this calculation we've used 9.6%, which is based on a levered beta of 1.346. Beta is a measure of a stock's volatility, compared to the market as a whole. We get our beta from the industry average beta of globally comparable companies, with an imposed limit between 0.8 and 2.0, which is a reasonable range for a stable business.
SWOT Analysis for Haier Smart Home
- Earnings growth over the past year exceeded the industry.
- Debt is not viewed as a risk.
- Dividends are covered by earnings and cash flows.
- Dividend is in the top 25% of dividend payers in the market.
- Earnings growth over the past year is below its 5-year average.
- Annual earnings are forecast to grow for the next 3 years.
- Good value based on P/E ratio and estimated fair value.
- Annual earnings are forecast to grow slower than the Chinese market.
Moving On:
Valuation is only one side of the coin in terms of building your investment thesis, and it ideally won't be the sole piece of analysis you scrutinize for a company. The DCF model is not a perfect stock valuation tool. Rather it should be seen as a guide to "what assumptions need to be true for this stock to be under/overvalued?" If a company grows at a different rate, or if its cost of equity or risk free rate changes sharply, the output can look very different. Can we work out why the company is trading at a discount to intrinsic value? For Haier Smart Home, we've compiled three additional items you should consider:
- Financial Health: Does 600690 have a healthy balance sheet? Take a look at our free balance sheet analysis with six simple checks on key factors like leverage and risk.
- Future Earnings: How does 600690's growth rate compare to its peers and the wider market? Dig deeper into the analyst consensus number for the upcoming years by interacting with our free analyst growth expectation chart.
- Other Solid Businesses: Low debt, high returns on equity and good past performance are fundamental to a strong business. Why not explore our interactive list of stocks with solid business fundamentals to see if there are other companies you may not have considered!
PS. The Simply Wall St app conducts a discounted cash flow valuation for every stock on the SHSE every day. If you want to find the calculation for other stocks just search here.
Valuation is complex, but we're here to simplify it.
Discover if Haier Smart Home might be undervalued or overvalued with our detailed analysis, featuring fair value estimates, potential risks, dividends, insider trades, and its financial condition.
Access Free AnalysisHave feedback on this article? Concerned about the content? Get in touch with us directly. Alternatively, email editorial-team (at) simplywallst.com.
This article by Simply Wall St is general in nature. We provide commentary based on historical data and analyst forecasts only using an unbiased methodology and our articles are not intended to be financial advice. It does not constitute a recommendation to buy or sell any stock, and does not take account of your objectives, or your financial situation. We aim to bring you long-term focused analysis driven by fundamental data. Note that our analysis may not factor in the latest price-sensitive company announcements or qualitative material. Simply Wall St has no position in any stocks mentioned.
About SHSE:600690
Haier Smart Home
Engages in the research, development, production, and sales of smart home appliances.
Very undervalued with flawless balance sheet and pays a dividend.
Similar Companies
Market Insights

Community Narratives


