
Advertisement
Shanghai Sanmao Enterprise (Group) Co., Ltd.'s (SHSE:600689) Popularity With Investors Under Threat As Stock Sinks 29%

Shanghai Sanmao Enterprise (Group) Co., Ltd. (SHSE:600689) shares have had a horrible month, losing 29% after a relatively good period beforehand. Longer-term shareholders would now have taken a real hit with the stock declining 2.4% in the last year.
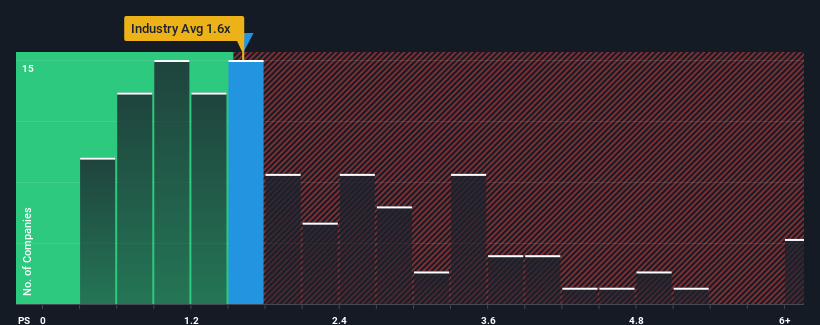
Even after such a large drop in price, you could still be forgiven for feeling indifferent about Shanghai Sanmao Enterprise (Group)'s P/S ratio of 1.6x, since the median price-to-sales (or "P/S") ratio for the Luxury industry in China is about the same. While this might not raise any eyebrows, if the P/S ratio is not justified investors could be missing out on a potential opportunity or ignoring looming disappointment.
Check out our latest analysis for Shanghai Sanmao Enterprise (Group)
What Does Shanghai Sanmao Enterprise (Group)'s P/S Mean For Shareholders?
The revenue growth achieved at Shanghai Sanmao Enterprise (Group) over the last year would be more than acceptable for most companies. It might be that many expect the respectable revenue performance to wane, which has kept the P/S from rising. If you like the company, you'd be hoping this isn't the case so that you could potentially pick up some stock while it's not quite in favour.
We don't have analyst forecasts, but you can see how recent trends are setting up the company for the future by checking out our free report on Shanghai Sanmao Enterprise (Group)'s earnings, revenue and cash flow.Do Revenue Forecasts Match The P/S Ratio?
In order to justify its P/S ratio, Shanghai Sanmao Enterprise (Group) would need to produce growth that's similar to the industry.
Retrospectively, the last year delivered a decent 8.1% gain to the company's revenues. The solid recent performance means it was also able to grow revenue by 6.9% in total over the last three years. So we can start by confirming that the company has actually done a good job of growing revenue over that time.
Comparing that to the industry, which is predicted to deliver 20% growth in the next 12 months, the company's momentum is weaker, based on recent medium-term annualised revenue results.
With this in mind, we find it intriguing that Shanghai Sanmao Enterprise (Group)'s P/S is comparable to that of its industry peers. It seems most investors are ignoring the fairly limited recent growth rates and are willing to pay up for exposure to the stock. Maintaining these prices will be difficult to achieve as a continuation of recent revenue trends is likely to weigh down the shares eventually.
What Does Shanghai Sanmao Enterprise (Group)'s P/S Mean For Investors?
Shanghai Sanmao Enterprise (Group)'s plummeting stock price has brought its P/S back to a similar region as the rest of the industry. It's argued the price-to-sales ratio is an inferior measure of value within certain industries, but it can be a powerful business sentiment indicator.
Our examination of Shanghai Sanmao Enterprise (Group) revealed its poor three-year revenue trends aren't resulting in a lower P/S as per our expectations, given they look worse than current industry outlook. Right now we are uncomfortable with the P/S as this revenue performance isn't likely to support a more positive sentiment for long. Unless the recent medium-term conditions improve, it's hard to accept the current share price as fair value.
You should always think about risks. Case in point, we've spotted 2 warning signs for Shanghai Sanmao Enterprise (Group) you should be aware of, and 1 of them is potentially serious.
If these risks are making you reconsider your opinion on Shanghai Sanmao Enterprise (Group), explore our interactive list of high quality stocks to get an idea of what else is out there.
New: Manage All Your Stock Portfolios in One Place
We've created the ultimate portfolio companion for stock investors, and it's free.
• Connect an unlimited number of Portfolios and see your total in one currency
• Be alerted to new Warning Signs or Risks via email or mobile
• Track the Fair Value of your stocks
Have feedback on this article? Concerned about the content? Get in touch with us directly. Alternatively, email editorial-team (at) simplywallst.com.
This article by Simply Wall St is general in nature. We provide commentary based on historical data and analyst forecasts only using an unbiased methodology and our articles are not intended to be financial advice. It does not constitute a recommendation to buy or sell any stock, and does not take account of your objectives, or your financial situation. We aim to bring you long-term focused analysis driven by fundamental data. Note that our analysis may not factor in the latest price-sensitive company announcements or qualitative material. Simply Wall St has no position in any stocks mentioned.
About SHSE:600689
Shanghai Sanmao Enterprise (Group)
Shanghai Sanmao Enterprise (Group) Co., Ltd.
Mediocre balance sheet with questionable track record.
Market Insights

Advertisement
Community Narratives

BMW cruising ahead with new EVs and premium models to boost revenue 5%
Fair Value €135.07|44.6% undervalued
UN
Community Contributor
EU#2 - From Humble Beginnings to Global Powerhouse
Fair Value DKK 851.04|46.4% undervalued
TO
Community Contributor