- China
- /
- Commercial Services
- /
- SZSE:300844
Guangzhou S.P.I Design Co., Ltd.'s (SZSE:300844) 29% Dip Still Leaving Some Shareholders Feeling Restless Over Its P/SRatio


To the annoyance of some shareholders, Guangzhou S.P.I Design Co., Ltd. (SZSE:300844) shares are down a considerable 29% in the last month, which continues a horrid run for the company. The drop over the last 30 days has capped off a tough year for shareholders, with the share price down 34% in that time.
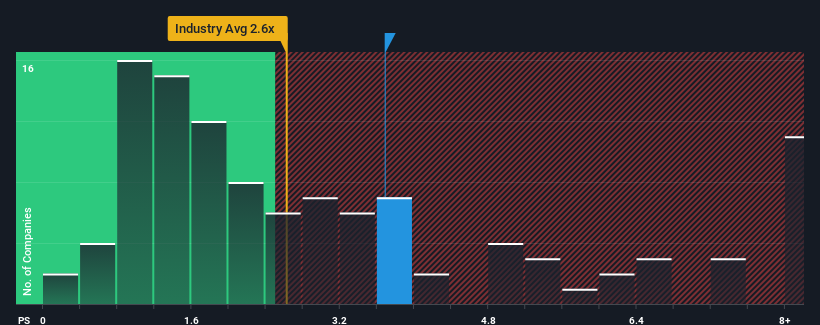
Although its price has dipped substantially, given close to half the companies operating in China's Commercial Services industry have price-to-sales ratios (or "P/S") below 2.6x, you may still consider Guangzhou S.P.I Design as a stock to potentially avoid with its 3.7x P/S ratio. Although, it's not wise to just take the P/S at face value as there may be an explanation why it's as high as it is.
View our latest analysis for Guangzhou S.P.I Design
What Does Guangzhou S.P.I Design's Recent Performance Look Like?
For example, consider that Guangzhou S.P.I Design's financial performance has been poor lately as its revenue has been in decline. Perhaps the market believes the company can do enough to outperform the rest of the industry in the near future, which is keeping the P/S ratio high. You'd really hope so, otherwise you're paying a pretty hefty price for no particular reason.
Want the full picture on earnings, revenue and cash flow for the company? Then our free report on Guangzhou S.P.I Design will help you shine a light on its historical performance.Do Revenue Forecasts Match The High P/S Ratio?
Guangzhou S.P.I Design's P/S ratio would be typical for a company that's expected to deliver solid growth, and importantly, perform better than the industry.
In reviewing the last year of financials, we were disheartened to see the company's revenues fell to the tune of 23%. As a result, revenue from three years ago have also fallen 35% overall. So unfortunately, we have to acknowledge that the company has not done a great job of growing revenue over that time.
Comparing that to the industry, which is predicted to deliver 28% growth in the next 12 months, the company's downward momentum based on recent medium-term revenue results is a sobering picture.
With this information, we find it concerning that Guangzhou S.P.I Design is trading at a P/S higher than the industry. It seems most investors are ignoring the recent poor growth rate and are hoping for a turnaround in the company's business prospects. Only the boldest would assume these prices are sustainable as a continuation of recent revenue trends is likely to weigh heavily on the share price eventually.
The Bottom Line On Guangzhou S.P.I Design's P/S
Guangzhou S.P.I Design's P/S remain high even after its stock plunged. Using the price-to-sales ratio alone to determine if you should sell your stock isn't sensible, however it can be a practical guide to the company's future prospects.
We've established that Guangzhou S.P.I Design currently trades on a much higher than expected P/S since its recent revenues have been in decline over the medium-term. Right now we aren't comfortable with the high P/S as this revenue performance is highly unlikely to support such positive sentiment for long. Unless the the circumstances surrounding the recent medium-term improve, it wouldn't be wrong to expect a a difficult period ahead for the company's shareholders.
Before you settle on your opinion, we've discovered 2 warning signs for Guangzhou S.P.I Design that you should be aware of.
It's important to make sure you look for a great company, not just the first idea you come across. So if growing profitability aligns with your idea of a great company, take a peek at this free list of interesting companies with strong recent earnings growth (and a low P/E).
New: Manage All Your Stock Portfolios in One Place
We've created the ultimate portfolio companion for stock investors, and it's free.
• Connect an unlimited number of Portfolios and see your total in one currency
• Be alerted to new Warning Signs or Risks via email or mobile
• Track the Fair Value of your stocks
Have feedback on this article? Concerned about the content? Get in touch with us directly. Alternatively, email editorial-team (at) simplywallst.com.
This article by Simply Wall St is general in nature. We provide commentary based on historical data and analyst forecasts only using an unbiased methodology and our articles are not intended to be financial advice. It does not constitute a recommendation to buy or sell any stock, and does not take account of your objectives, or your financial situation. We aim to bring you long-term focused analysis driven by fundamental data. Note that our analysis may not factor in the latest price-sensitive company announcements or qualitative material. Simply Wall St has no position in any stocks mentioned.
About SZSE:300844
Adequate balance sheet with questionable track record.
Market Insights

Community Narratives

