
Advertisement
- China
- /
- Professional Services
- /
- SZSE:300826
Getting In Cheap On NanJing Research Institute of Surveying, Mapping & Geotechnical Investigation, Co.Ltd (SZSE:300826) Is Unlikely
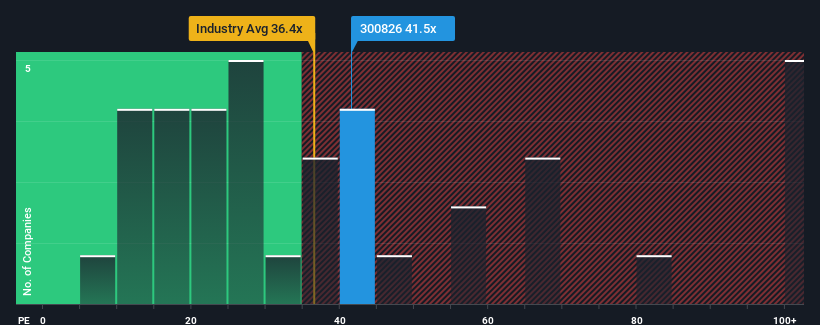
With a price-to-earnings (or "P/E") ratio of 41.5x NanJing Research Institute of Surveying, Mapping & Geotechnical Investigation, Co.Ltd (SZSE:300826) may be sending bearish signals at the moment, given that almost half of all companies in China have P/E ratios under 30x and even P/E's lower than 18x are not unusual. Although, it's not wise to just take the P/E at face value as there may be an explanation why it's as high as it is.
For instance, NanJing Research Institute of Surveying Mapping & Geotechnical InvestigationLtd's receding earnings in recent times would have to be some food for thought. It might be that many expect the company to still outplay most other companies over the coming period, which has kept the P/E from collapsing. You'd really hope so, otherwise you're paying a pretty hefty price for no particular reason.
What Are Growth Metrics Telling Us About The High P/E?
The only time you'd be truly comfortable seeing a P/E as high as NanJing Research Institute of Surveying Mapping & Geotechnical InvestigationLtd's is when the company's growth is on track to outshine the market.
If we review the last year of earnings, dishearteningly the company's profits fell to the tune of 43%. This means it has also seen a slide in earnings over the longer-term as EPS is down 51% in total over the last three years. So unfortunately, we have to acknowledge that the company has not done a great job of growing earnings over that time.
In contrast to the company, the rest of the market is expected to grow by 38% over the next year, which really puts the company's recent medium-term earnings decline into perspective.
In light of this, it's alarming that NanJing Research Institute of Surveying Mapping & Geotechnical InvestigationLtd's P/E sits above the majority of other companies. It seems most investors are ignoring the recent poor growth rate and are hoping for a turnaround in the company's business prospects. Only the boldest would assume these prices are sustainable as a continuation of recent earnings trends is likely to weigh heavily on the share price eventually.
The Final Word
We'd say the price-to-earnings ratio's power isn't primarily as a valuation instrument but rather to gauge current investor sentiment and future expectations.
Our examination of NanJing Research Institute of Surveying Mapping & Geotechnical InvestigationLtd revealed its shrinking earnings over the medium-term aren't impacting its high P/E anywhere near as much as we would have predicted, given the market is set to grow. When we see earnings heading backwards and underperforming the market forecasts, we suspect the share price is at risk of declining, sending the high P/E lower. Unless the recent medium-term conditions improve markedly, it's very challenging to accept these prices as being reasonable.
You should always think about risks. Case in point, we've spotted 6 warning signs for NanJing Research Institute of Surveying Mapping & Geotechnical InvestigationLtd you should be aware of, and 1 of them is concerning.
If these risks are making you reconsider your opinion on NanJing Research Institute of Surveying Mapping & Geotechnical InvestigationLtd, explore our interactive list of high quality stocks to get an idea of what else is out there.
Valuation is complex, but we're here to simplify it.
Discover if NanJing Research Institute of Surveying Mapping & Geotechnical InvestigationCo.Ltd might be undervalued or overvalued with our detailed analysis, featuring fair value estimates, potential risks, dividends, insider trades, and its financial condition.
Access Free AnalysisHave feedback on this article? Concerned about the content? Get in touch with us directly. Alternatively, email editorial-team (at) simplywallst.com.
This article by Simply Wall St is general in nature. We provide commentary based on historical data and analyst forecasts only using an unbiased methodology and our articles are not intended to be financial advice. It does not constitute a recommendation to buy or sell any stock, and does not take account of your objectives, or your financial situation. We aim to bring you long-term focused analysis driven by fundamental data. Note that our analysis may not factor in the latest price-sensitive company announcements or qualitative material. Simply Wall St has no position in any stocks mentioned.
About SZSE:300826
NanJing Research Institute of Surveying Mapping & Geotechnical InvestigationCo.Ltd
NanJing Research Institute of Surveying, Mapping & Geotechnical Investigation,Co.Ltd.
Adequate balance sheet with low risk.
Market Insights

Advertisement
Community Narratives
Finding The True Value Of A Logistics Powerhouse
Fair Value US$95.21|7.5% undervalued
NV
Community Contributor
Paradigm Biopharmaceuticals Will Lead Osteoarthritis Treatment with Zilosul's FDA Success
Fair Value AU$5.50|93.3% undervalued
AM
Community Contributor
Barrick Mining (ABX:CA): A Gold Hedge against a U.S. Shutdown
Fair Value CA$60.00|26.4% undervalued
GM
Community Contributor