
Advertisement
- China
- /
- Professional Services
- /
- SZSE:300556
Some Silkroad Visual Technology Co., Ltd. (SZSE:300556) Shareholders Look For Exit As Shares Take 27% Pounding

Silkroad Visual Technology Co., Ltd. (SZSE:300556) shareholders that were waiting for something to happen have been dealt a blow with a 27% share price drop in the last month. Instead of being rewarded, shareholders who have already held through the last twelve months are now sitting on a 28% share price drop.
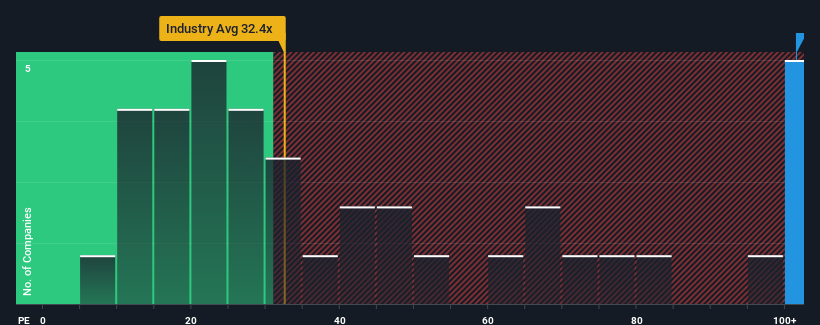
In spite of the heavy fall in price, Silkroad Visual Technology may still be sending very bearish signals at the moment with a price-to-earnings (or "P/E") ratio of 101.5x, since almost half of all companies in China have P/E ratios under 29x and even P/E's lower than 18x are not unusual. Although, it's not wise to just take the P/E at face value as there may be an explanation why it's so lofty.
For instance, Silkroad Visual Technology's receding earnings in recent times would have to be some food for thought. One possibility is that the P/E is high because investors think the company will still do enough to outperform the broader market in the near future. If not, then existing shareholders may be quite nervous about the viability of the share price.
Check out our latest analysis for Silkroad Visual Technology
Is There Enough Growth For Silkroad Visual Technology?
The only time you'd be truly comfortable seeing a P/E as steep as Silkroad Visual Technology's is when the company's growth is on track to outshine the market decidedly.
Retrospectively, the last year delivered a frustrating 51% decrease to the company's bottom line. The last three years don't look nice either as the company has shrunk EPS by 64% in aggregate. So unfortunately, we have to acknowledge that the company has not done a great job of growing earnings over that time.
Comparing that to the market, which is predicted to deliver 36% growth in the next 12 months, the company's downward momentum based on recent medium-term earnings results is a sobering picture.
With this information, we find it concerning that Silkroad Visual Technology is trading at a P/E higher than the market. It seems most investors are ignoring the recent poor growth rate and are hoping for a turnaround in the company's business prospects. Only the boldest would assume these prices are sustainable as a continuation of recent earnings trends is likely to weigh heavily on the share price eventually.
The Final Word
Even after such a strong price drop, Silkroad Visual Technology's P/E still exceeds the rest of the market significantly. It's argued the price-to-earnings ratio is an inferior measure of value within certain industries, but it can be a powerful business sentiment indicator.
Our examination of Silkroad Visual Technology revealed its shrinking earnings over the medium-term aren't impacting its high P/E anywhere near as much as we would have predicted, given the market is set to grow. Right now we are increasingly uncomfortable with the high P/E as this earnings performance is highly unlikely to support such positive sentiment for long. If recent medium-term earnings trends continue, it will place shareholders' investments at significant risk and potential investors in danger of paying an excessive premium.
And what about other risks? Every company has them, and we've spotted 2 warning signs for Silkroad Visual Technology (of which 1 is potentially serious!) you should know about.
It's important to make sure you look for a great company, not just the first idea you come across. So take a peek at this free list of interesting companies with strong recent earnings growth (and a low P/E).
New: Manage All Your Stock Portfolios in One Place
We've created the ultimate portfolio companion for stock investors, and it's free.
• Connect an unlimited number of Portfolios and see your total in one currency
• Be alerted to new Warning Signs or Risks via email or mobile
• Track the Fair Value of your stocks
Have feedback on this article? Concerned about the content? Get in touch with us directly. Alternatively, email editorial-team (at) simplywallst.com.
This article by Simply Wall St is general in nature. We provide commentary based on historical data and analyst forecasts only using an unbiased methodology and our articles are not intended to be financial advice. It does not constitute a recommendation to buy or sell any stock, and does not take account of your objectives, or your financial situation. We aim to bring you long-term focused analysis driven by fundamental data. Note that our analysis may not factor in the latest price-sensitive company announcements or qualitative material. Simply Wall St has no position in any stocks mentioned.
About SZSE:300556
Silkroad Visual Technology
Operates as a digital vision services business in China.
Mediocre balance sheet and slightly overvalued.
Market Insights

Advertisement
Community Narratives
Groundbreaking therapies that could change the treatment landscape for PTSD, fibromyalgia, MS & Alzheimer’s
Fair Value US$6.20|86.9% undervalued
CM
Community Contributor
DigitalOcean Will Grow 14% by Embracing AI with Paperspace Acquisition
Fair Value US$50.00|42.8% undervalued
NE
Community Contributor
Viant Technology: A Rising AdTech Challenger in the AI-Powered CTV Market
Fair Value US$38.61|66.0% undervalued
BL
Community Contributor
Volvo will Accelerate Forward into Electric and Autonomous Leadership in Five Years
Fair Value SEK 438.80|40.8% undervalued
UN
Community Contributor