
Advertisement
- China
- /
- Professional Services
- /
- SZSE:002967
Here's What's Concerning About GRG Metrology & Test Group's (SZSE:002967) Returns On Capital

There are a few key trends to look for if we want to identify the next multi-bagger. In a perfect world, we'd like to see a company investing more capital into its business and ideally the returns earned from that capital are also increasing. This shows us that it's a compounding machine, able to continually reinvest its earnings back into the business and generate higher returns. Having said that, from a first glance at GRG Metrology & Test Group (SZSE:002967) we aren't jumping out of our chairs at how returns are trending, but let's have a deeper look.
Return On Capital Employed (ROCE): What Is It?
Just to clarify if you're unsure, ROCE is a metric for evaluating how much pre-tax income (in percentage terms) a company earns on the capital invested in its business. The formula for this calculation on GRG Metrology & Test Group is:
Return on Capital Employed = Earnings Before Interest and Tax (EBIT) ÷ (Total Assets - Current Liabilities)
0.059 = CN¥270m ÷ (CN¥6.2b - CN¥1.6b) (Based on the trailing twelve months to June 2024).
Thus, GRG Metrology & Test Group has an ROCE of 5.9%. Even though it's in line with the industry average of 6.4%, it's still a low return by itself.
See our latest analysis for GRG Metrology & Test Group
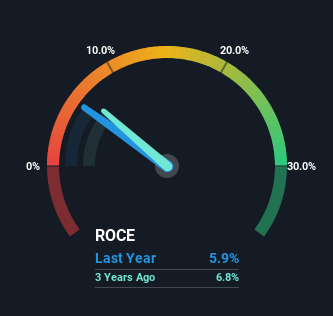
Above you can see how the current ROCE for GRG Metrology & Test Group compares to its prior returns on capital, but there's only so much you can tell from the past. If you're interested, you can view the analysts predictions in our free analyst report for GRG Metrology & Test Group .
What The Trend Of ROCE Can Tell Us
On the surface, the trend of ROCE at GRG Metrology & Test Group doesn't inspire confidence. To be more specific, ROCE has fallen from 16% over the last five years. However it looks like GRG Metrology & Test Group might be reinvesting for long term growth because while capital employed has increased, the company's sales haven't changed much in the last 12 months. It's worth keeping an eye on the company's earnings from here on to see if these investments do end up contributing to the bottom line.
On a side note, GRG Metrology & Test Group has done well to pay down its current liabilities to 26% of total assets. That could partly explain why the ROCE has dropped. Effectively this means their suppliers or short-term creditors are funding less of the business, which reduces some elements of risk. Since the business is basically funding more of its operations with it's own money, you could argue this has made the business less efficient at generating ROCE.
The Key Takeaway
Bringing it all together, while we're somewhat encouraged by GRG Metrology & Test Group's reinvestment in its own business, we're aware that returns are shrinking. Since the stock has declined 60% over the last three years, investors may not be too optimistic on this trend improving either. Therefore based on the analysis done in this article, we don't think GRG Metrology & Test Group has the makings of a multi-bagger.
If you want to continue researching GRG Metrology & Test Group, you might be interested to know about the 1 warning sign that our analysis has discovered.
While GRG Metrology & Test Group may not currently earn the highest returns, we've compiled a list of companies that currently earn more than 25% return on equity. Check out this free list here.
New: Manage All Your Stock Portfolios in One Place
We've created the ultimate portfolio companion for stock investors, and it's free.
• Connect an unlimited number of Portfolios and see your total in one currency
• Be alerted to new Warning Signs or Risks via email or mobile
• Track the Fair Value of your stocks
Have feedback on this article? Concerned about the content? Get in touch with us directly. Alternatively, email editorial-team (at) simplywallst.com.
This article by Simply Wall St is general in nature. We provide commentary based on historical data and analyst forecasts only using an unbiased methodology and our articles are not intended to be financial advice. It does not constitute a recommendation to buy or sell any stock, and does not take account of your objectives, or your financial situation. We aim to bring you long-term focused analysis driven by fundamental data. Note that our analysis may not factor in the latest price-sensitive company announcements or qualitative material. Simply Wall St has no position in any stocks mentioned.
About SZSE:002967
GRG Metrology & Test Group
Operates as a third-party measurement and testing technology service company.
Flawless balance sheet with solid track record.
Market Insights

Advertisement
Community Narratives
Groundbreaking therapies that could change the treatment landscape for PTSD, fibromyalgia, MS & Alzheimer’s
Fair Value US$6.20|86.9% undervalued
CM
Community Contributor
DigitalOcean Will Grow 14% by Embracing AI with Paperspace Acquisition
Fair Value US$50.00|42.8% undervalued
NE
Community Contributor
Viant Technology: A Rising AdTech Challenger in the AI-Powered CTV Market
Fair Value US$38.61|66.0% undervalued
BL
Community Contributor
Volvo will Accelerate Forward into Electric and Autonomous Leadership in Five Years
Fair Value SEK 438.80|40.8% undervalued
UN
Community Contributor