
Advertisement
- China
- /
- Commercial Services
- /
- SZSE:002229
Some Hongbo Co.,Ltd. (SZSE:002229) Shareholders Look For Exit As Shares Take 29% Pounding

To the annoyance of some shareholders, Hongbo Co.,Ltd. (SZSE:002229) shares are down a considerable 29% in the last month, which continues a horrid run for the company. For any long-term shareholders, the last month ends a year to forget by locking in a 65% share price decline.
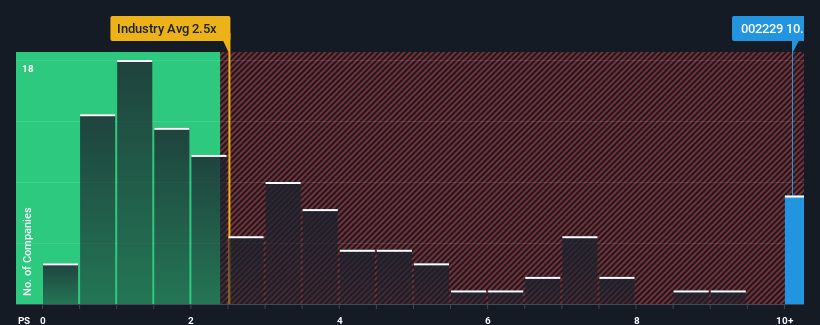
Although its price has dipped substantially, given around half the companies in China's Commercial Services industry have price-to-sales ratios (or "P/S") below 2.5x, you may still consider HongboLtd as a stock to avoid entirely with its 10.1x P/S ratio. However, the P/S might be quite high for a reason and it requires further investigation to determine if it's justified.
View our latest analysis for HongboLtd
What Does HongboLtd's P/S Mean For Shareholders?
The revenue growth achieved at HongboLtd over the last year would be more than acceptable for most companies. One possibility is that the P/S ratio is high because investors think this respectable revenue growth will be enough to outperform the broader industry in the near future. However, if this isn't the case, investors might get caught out paying too much for the stock.
We don't have analyst forecasts, but you can see how recent trends are setting up the company for the future by checking out our free report on HongboLtd's earnings, revenue and cash flow.How Is HongboLtd's Revenue Growth Trending?
There's an inherent assumption that a company should far outperform the industry for P/S ratios like HongboLtd's to be considered reasonable.
Taking a look back first, we see that the company managed to grow revenues by a handy 11% last year. Revenue has also lifted 13% in aggregate from three years ago, partly thanks to the last 12 months of growth. Accordingly, shareholders would have probably been satisfied with the medium-term rates of revenue growth.
Comparing the recent medium-term revenue trends against the industry's one-year growth forecast of 31% shows it's noticeably less attractive.
With this in mind, we find it worrying that HongboLtd's P/S exceeds that of its industry peers. Apparently many investors in the company are way more bullish than recent times would indicate and aren't willing to let go of their stock at any price. There's a good chance existing shareholders are setting themselves up for future disappointment if the P/S falls to levels more in line with recent growth rates.
The Key Takeaway
Even after such a strong price drop, HongboLtd's P/S still exceeds the industry median significantly. We'd say the price-to-sales ratio's power isn't primarily as a valuation instrument but rather to gauge current investor sentiment and future expectations.
Our examination of HongboLtd revealed its poor three-year revenue trends aren't detracting from the P/S as much as we though, given they look worse than current industry expectations. Right now we aren't comfortable with the high P/S as this revenue performance isn't likely to support such positive sentiment for long. If recent medium-term revenue trends continue, it will place shareholders' investments at significant risk and potential investors in danger of paying an excessive premium.
Before you settle on your opinion, we've discovered 2 warning signs for HongboLtd (1 is potentially serious!) that you should be aware of.
If strong companies turning a profit tickle your fancy, then you'll want to check out this free list of interesting companies that trade on a low P/E (but have proven they can grow earnings).
Valuation is complex, but we're here to simplify it.
Discover if HongboLtd might be undervalued or overvalued with our detailed analysis, featuring fair value estimates, potential risks, dividends, insider trades, and its financial condition.
Access Free AnalysisHave feedback on this article? Concerned about the content? Get in touch with us directly. Alternatively, email editorial-team (at) simplywallst.com.
This article by Simply Wall St is general in nature. We provide commentary based on historical data and analyst forecasts only using an unbiased methodology and our articles are not intended to be financial advice. It does not constitute a recommendation to buy or sell any stock, and does not take account of your objectives, or your financial situation. We aim to bring you long-term focused analysis driven by fundamental data. Note that our analysis may not factor in the latest price-sensitive company announcements or qualitative material. Simply Wall St has no position in any stocks mentioned.
Have feedback on this article? Concerned about the content? Get in touch with us directly. Alternatively, email editorial-team@simplywallst.com
About SZSE:002229
HongboLtd
Engages in the security printing business in China and internationally.
Excellent balance sheet very low.
Market Insights


Advertisement
Community Narratives
The Future of Drug Testing? Fingerprint Tech Shows Serious Promise
Fair Value US$2.98|40.3% undervalued
JO
Community Contributor
Suncorp’s Next Chapter: Insurance-Only and Ready to Grow
Fair Value AU$22.83|8.8% undervalued
RO
Community Contributor
Thyssenkrupp Nucera Will Achieve Double-Digit Profits by 2030 Boosted by Hydrogen Growth
Fair Value €14.40|31.3% undervalued
CH
Community Contributor
Tesla’s Nvidia Moment – The AI & Robotics Inflection Point
Fair Value US$384.84|18.1% undervalued
BL
Community Contributor