Some Confidence Is Lacking In Shanghai Rychen Technologies Co., Ltd.'s (SZSE:301273) P/S


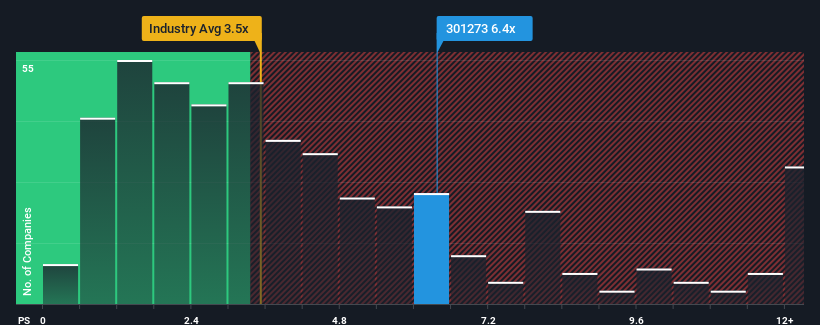
Shanghai Rychen Technologies Co., Ltd.'s (SZSE:301273) price-to-sales (or "P/S") ratio of 6.4x may look like a poor investment opportunity when you consider close to half the companies in the Machinery industry in China have P/S ratios below 3.5x. However, the P/S might be quite high for a reason and it requires further investigation to determine if it's justified.
View our latest analysis for Shanghai Rychen Technologies
How Shanghai Rychen Technologies Has Been Performing
For example, consider that Shanghai Rychen Technologies' financial performance has been poor lately as its revenue has been in decline. Perhaps the market believes the company can do enough to outperform the rest of the industry in the near future, which is keeping the P/S ratio high. However, if this isn't the case, investors might get caught out paying too much for the stock.
Want the full picture on earnings, revenue and cash flow for the company? Then our free report on Shanghai Rychen Technologies will help you shine a light on its historical performance.How Is Shanghai Rychen Technologies' Revenue Growth Trending?
There's an inherent assumption that a company should far outperform the industry for P/S ratios like Shanghai Rychen Technologies' to be considered reasonable.
In reviewing the last year of financials, we were disheartened to see the company's revenues fell to the tune of 15%. This means it has also seen a slide in revenue over the longer-term as revenue is down 29% in total over the last three years. So unfortunately, we have to acknowledge that the company has not done a great job of growing revenue over that time.
In contrast to the company, the rest of the industry is expected to grow by 23% over the next year, which really puts the company's recent medium-term revenue decline into perspective.
In light of this, it's alarming that Shanghai Rychen Technologies' P/S sits above the majority of other companies. Apparently many investors in the company are way more bullish than recent times would indicate and aren't willing to let go of their stock at any price. Only the boldest would assume these prices are sustainable as a continuation of recent revenue trends is likely to weigh heavily on the share price eventually.
What We Can Learn From Shanghai Rychen Technologies' P/S?
While the price-to-sales ratio shouldn't be the defining factor in whether you buy a stock or not, it's quite a capable barometer of revenue expectations.
We've established that Shanghai Rychen Technologies currently trades on a much higher than expected P/S since its recent revenues have been in decline over the medium-term. With a revenue decline on investors' minds, the likelihood of a souring sentiment is quite high which could send the P/S back in line with what we'd expect. Unless the the circumstances surrounding the recent medium-term improve, it wouldn't be wrong to expect a a difficult period ahead for the company's shareholders.
Don't forget that there may be other risks. For instance, we've identified 2 warning signs for Shanghai Rychen Technologies that you should be aware of.
If these risks are making you reconsider your opinion on Shanghai Rychen Technologies, explore our interactive list of high quality stocks to get an idea of what else is out there.
If you're looking to trade Shanghai Rychen Technologies, open an account with the lowest-cost platform trusted by professionals, Interactive Brokers.
With clients in over 200 countries and territories, and access to 160 markets, IBKR lets you trade stocks, options, futures, forex, bonds and funds from a single integrated account.
Enjoy no hidden fees, no account minimums, and FX conversion rates as low as 0.03%, far better than what most brokers offer.
Sponsored ContentNew: Manage All Your Stock Portfolios in One Place
We've created the ultimate portfolio companion for stock investors, and it's free.
• Connect an unlimited number of Portfolios and see your total in one currency
• Be alerted to new Warning Signs or Risks via email or mobile
• Track the Fair Value of your stocks
Have feedback on this article? Concerned about the content? Get in touch with us directly. Alternatively, email editorial-team (at) simplywallst.com.
This article by Simply Wall St is general in nature. We provide commentary based on historical data and analyst forecasts only using an unbiased methodology and our articles are not intended to be financial advice. It does not constitute a recommendation to buy or sell any stock, and does not take account of your objectives, or your financial situation. We aim to bring you long-term focused analysis driven by fundamental data. Note that our analysis may not factor in the latest price-sensitive company announcements or qualitative material. Simply Wall St has no position in any stocks mentioned.
About SZSE:301273
Shanghai Rychen Technologies
Engages in the energy conservation and environmental protection business in China.
Adequate balance sheet very low.
Market Insights

Community Narratives

