
Advertisement
- China
- /
- Construction
- /
- SZSE:300982
Suwen Electric Energy Technology Co.,Ltd. (SZSE:300982) Stocks Shoot Up 28% But Its P/S Still Looks Reasonable

Suwen Electric Energy Technology Co.,Ltd. (SZSE:300982) shareholders would be excited to see that the share price has had a great month, posting a 28% gain and recovering from prior weakness. Unfortunately, the gains of the last month did little to right the losses of the last year with the stock still down 38% over that time.
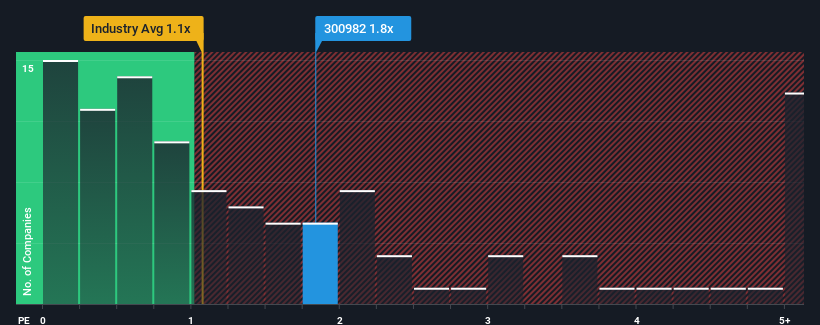
Following the firm bounce in price, you could be forgiven for thinking Suwen Electric Energy TechnologyLtd is a stock not worth researching with a price-to-sales ratios (or "P/S") of 1.8x, considering almost half the companies in China's Construction industry have P/S ratios below 1.1x. Although, it's not wise to just take the P/S at face value as there may be an explanation why it's as high as it is.
See our latest analysis for Suwen Electric Energy TechnologyLtd
How Has Suwen Electric Energy TechnologyLtd Performed Recently?
Suwen Electric Energy TechnologyLtd could be doing better as its revenue has been going backwards lately while most other companies have been seeing positive revenue growth. It might be that many expect the dour revenue performance to recover substantially, which has kept the P/S from collapsing. However, if this isn't the case, investors might get caught out paying too much for the stock.
Want the full picture on analyst estimates for the company? Then our free report on Suwen Electric Energy TechnologyLtd will help you uncover what's on the horizon.What Are Revenue Growth Metrics Telling Us About The High P/S?
There's an inherent assumption that a company should outperform the industry for P/S ratios like Suwen Electric Energy TechnologyLtd's to be considered reasonable.
Taking a look back first, the company's revenue growth last year wasn't something to get excited about as it posted a disappointing decline of 15%. Even so, admirably revenue has lifted 45% in aggregate from three years ago, notwithstanding the last 12 months. So we can start by confirming that the company has generally done a very good job of growing revenue over that time, even though it had some hiccups along the way.
Turning to the outlook, the next year should generate growth of 65% as estimated by the five analysts watching the company. That's shaping up to be materially higher than the 14% growth forecast for the broader industry.
With this information, we can see why Suwen Electric Energy TechnologyLtd is trading at such a high P/S compared to the industry. Apparently shareholders aren't keen to offload something that is potentially eyeing a more prosperous future.
The Final Word
Suwen Electric Energy TechnologyLtd shares have taken a big step in a northerly direction, but its P/S is elevated as a result. Generally, our preference is to limit the use of the price-to-sales ratio to establishing what the market thinks about the overall health of a company.
As we suspected, our examination of Suwen Electric Energy TechnologyLtd's analyst forecasts revealed that its superior revenue outlook is contributing to its high P/S. Right now shareholders are comfortable with the P/S as they are quite confident future revenues aren't under threat. Unless the analysts have really missed the mark, these strong revenue forecasts should keep the share price buoyant.
You need to take note of risks, for example - Suwen Electric Energy TechnologyLtd has 3 warning signs (and 1 which makes us a bit uncomfortable) we think you should know about.
Of course, profitable companies with a history of great earnings growth are generally safer bets. So you may wish to see this free collection of other companies that have reasonable P/E ratios and have grown earnings strongly.
New: Manage All Your Stock Portfolios in One Place
We've created the ultimate portfolio companion for stock investors, and it's free.
• Connect an unlimited number of Portfolios and see your total in one currency
• Be alerted to new Warning Signs or Risks via email or mobile
• Track the Fair Value of your stocks
Have feedback on this article? Concerned about the content? Get in touch with us directly. Alternatively, email editorial-team (at) simplywallst.com.
This article by Simply Wall St is general in nature. We provide commentary based on historical data and analyst forecasts only using an unbiased methodology and our articles are not intended to be financial advice. It does not constitute a recommendation to buy or sell any stock, and does not take account of your objectives, or your financial situation. We aim to bring you long-term focused analysis driven by fundamental data. Note that our analysis may not factor in the latest price-sensitive company announcements or qualitative material. Simply Wall St has no position in any stocks mentioned.
About SZSE:300982
Suwen Electric Energy TechnologyLtd
Suwen Electric Energy Technology Co.,Ltd.
Flawless balance sheet with high growth potential.
Market Insights

Advertisement
Community Narratives
Groundbreaking therapies that could change the treatment landscape for PTSD, fibromyalgia, MS & Alzheimer’s
Fair Value US$6.20|86.9% undervalued
CM
Community Contributor
DigitalOcean Will Grow 14% by Embracing AI with Paperspace Acquisition
Fair Value US$50.00|42.8% undervalued
NE
Community Contributor
Viant Technology: A Rising AdTech Challenger in the AI-Powered CTV Market
Fair Value US$38.61|66.0% undervalued
BL
Community Contributor
Volvo will Accelerate Forward into Electric and Autonomous Leadership in Five Years
Fair Value SEK 438.80|40.8% undervalued
UN
Community Contributor