
Advertisement
Shenzhen Tongye Technology Co.,Ltd. (SZSE:300960) May Have Run Too Fast Too Soon With Recent 36% Price Plummet

Shenzhen Tongye Technology Co.,Ltd. (SZSE:300960) shares have retraced a considerable 36% in the last month, reversing a fair amount of their solid recent performance. The recent drop has obliterated the annual return, with the share price now down 7.8% over that longer period.
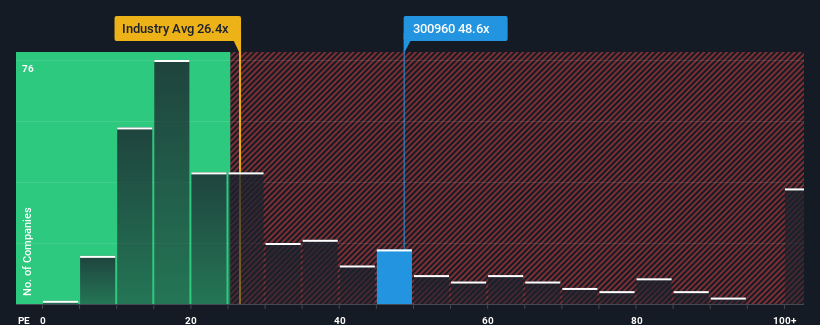
Although its price has dipped substantially, Shenzhen Tongye TechnologyLtd's price-to-earnings (or "P/E") ratio of 48.6x might still make it look like a strong sell right now compared to the market in China, where around half of the companies have P/E ratios below 26x and even P/E's below 16x are quite common. However, the P/E might be quite high for a reason and it requires further investigation to determine if it's justified.
The earnings growth achieved at Shenzhen Tongye TechnologyLtd over the last year would be more than acceptable for most companies. It might be that many expect the respectable earnings performance to beat most other companies over the coming period, which has increased investors’ willingness to pay up for the stock. If not, then existing shareholders may be a little nervous about the viability of the share price.
Check out our latest analysis for Shenzhen Tongye TechnologyLtd
Does Growth Match The High P/E?
Shenzhen Tongye TechnologyLtd's P/E ratio would be typical for a company that's expected to deliver very strong growth, and importantly, perform much better than the market.
Taking a look back first, we see that the company grew earnings per share by an impressive 19% last year. However, this wasn't enough as the latest three year period has seen a very unpleasant 42% drop in EPS in aggregate. Accordingly, shareholders would have felt downbeat about the medium-term rates of earnings growth.
Weighing that medium-term earnings trajectory against the broader market's one-year forecast for expansion of 36% shows it's an unpleasant look.
In light of this, it's alarming that Shenzhen Tongye TechnologyLtd's P/E sits above the majority of other companies. Apparently many investors in the company are way more bullish than recent times would indicate and aren't willing to let go of their stock at any price. Only the boldest would assume these prices are sustainable as a continuation of recent earnings trends is likely to weigh heavily on the share price eventually.
The Key Takeaway
A significant share price dive has done very little to deflate Shenzhen Tongye TechnologyLtd's very lofty P/E. It's argued the price-to-earnings ratio is an inferior measure of value within certain industries, but it can be a powerful business sentiment indicator.
Our examination of Shenzhen Tongye TechnologyLtd revealed its shrinking earnings over the medium-term aren't impacting its high P/E anywhere near as much as we would have predicted, given the market is set to grow. Right now we are increasingly uncomfortable with the high P/E as this earnings performance is highly unlikely to support such positive sentiment for long. Unless the recent medium-term conditions improve markedly, it's very challenging to accept these prices as being reasonable.
Plus, you should also learn about these 3 warning signs we've spotted with Shenzhen Tongye TechnologyLtd (including 2 which are significant).
You might be able to find a better investment than Shenzhen Tongye TechnologyLtd. If you want a selection of possible candidates, check out this free list of interesting companies that trade on a low P/E (but have proven they can grow earnings).
New: Manage All Your Stock Portfolios in One Place
We've created the ultimate portfolio companion for stock investors, and it's free.
• Connect an unlimited number of Portfolios and see your total in one currency
• Be alerted to new Warning Signs or Risks via email or mobile
• Track the Fair Value of your stocks
Have feedback on this article? Concerned about the content? Get in touch with us directly. Alternatively, email editorial-team (at) simplywallst.com.
This article by Simply Wall St is general in nature. We provide commentary based on historical data and analyst forecasts only using an unbiased methodology and our articles are not intended to be financial advice. It does not constitute a recommendation to buy or sell any stock, and does not take account of your objectives, or your financial situation. We aim to bring you long-term focused analysis driven by fundamental data. Note that our analysis may not factor in the latest price-sensitive company announcements or qualitative material. Simply Wall St has no position in any stocks mentioned.
About SZSE:300960
Shenzhen Tongye TechnologyLtd
Engages in the research and development, production, sale, and maintenance services of rail transit electrical equipment products in China.
Flawless balance sheet with proven track record.
Market Insights

Advertisement
Community Narratives
Groundbreaking therapies that could change the treatment landscape for PTSD, fibromyalgia, MS & Alzheimer’s
Fair Value US$6.20|86.9% undervalued
CM
Community Contributor
DigitalOcean Will Grow 14% by Embracing AI with Paperspace Acquisition
Fair Value US$50.00|42.8% undervalued
NE
Community Contributor
Viant Technology: A Rising AdTech Challenger in the AI-Powered CTV Market
Fair Value US$38.61|66.0% undervalued
BL
Community Contributor
Volvo will Accelerate Forward into Electric and Autonomous Leadership in Five Years
Fair Value SEK 438.80|40.8% undervalued
UN
Community Contributor