- China
- /
- Electrical
- /
- SZSE:300890
Shenzhen XFH Technology Co.,Ltd's (SZSE:300890) Shares Bounce 31% But Its Business Still Trails The Market


Those holding Shenzhen XFH Technology Co.,Ltd (SZSE:300890) shares would be relieved that the share price has rebounded 31% in the last thirty days, but it needs to keep going to repair the recent damage it has caused to investor portfolios. Not all shareholders will be feeling jubilant, since the share price is still down a very disappointing 34% in the last twelve months.
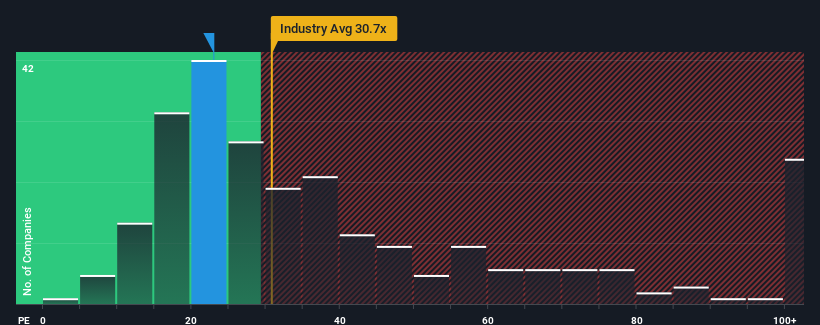
In spite of the firm bounce in price, Shenzhen XFH TechnologyLtd's price-to-earnings (or "P/E") ratio of 23x might still make it look like a buy right now compared to the market in China, where around half of the companies have P/E ratios above 31x and even P/E's above 56x are quite common. Nonetheless, we'd need to dig a little deeper to determine if there is a rational basis for the reduced P/E.
For instance, Shenzhen XFH TechnologyLtd's receding earnings in recent times would have to be some food for thought. It might be that many expect the disappointing earnings performance to continue or accelerate, which has repressed the P/E. If you like the company, you'd be hoping this isn't the case so that you could potentially pick up some stock while it's out of favour.
View our latest analysis for Shenzhen XFH TechnologyLtd
Is There Any Growth For Shenzhen XFH TechnologyLtd?
Shenzhen XFH TechnologyLtd's P/E ratio would be typical for a company that's only expected to deliver limited growth, and importantly, perform worse than the market.
Retrospectively, the last year delivered a frustrating 27% decrease to the company's bottom line. However, a few very strong years before that means that it was still able to grow EPS by an impressive 71% in total over the last three years. Although it's been a bumpy ride, it's still fair to say the earnings growth recently has been more than adequate for the company.
Weighing that recent medium-term earnings trajectory against the broader market's one-year forecast for expansion of 41% shows it's noticeably less attractive on an annualised basis.
With this information, we can see why Shenzhen XFH TechnologyLtd is trading at a P/E lower than the market. Apparently many shareholders weren't comfortable holding on to something they believe will continue to trail the bourse.
What We Can Learn From Shenzhen XFH TechnologyLtd's P/E?
Shenzhen XFH TechnologyLtd's stock might have been given a solid boost, but its P/E certainly hasn't reached any great heights. Using the price-to-earnings ratio alone to determine if you should sell your stock isn't sensible, however it can be a practical guide to the company's future prospects.
As we suspected, our examination of Shenzhen XFH TechnologyLtd revealed its three-year earnings trends are contributing to its low P/E, given they look worse than current market expectations. At this stage investors feel the potential for an improvement in earnings isn't great enough to justify a higher P/E ratio. If recent medium-term earnings trends continue, it's hard to see the share price rising strongly in the near future under these circumstances.
Before you take the next step, you should know about the 2 warning signs for Shenzhen XFH TechnologyLtd (1 is potentially serious!) that we have uncovered.
If P/E ratios interest you, you may wish to see this free collection of other companies with strong earnings growth and low P/E ratios.
If you're looking to trade Shanghai XFH Technology, open an account with the lowest-cost platform trusted by professionals, Interactive Brokers.
With clients in over 200 countries and territories, and access to 160 markets, IBKR lets you trade stocks, options, futures, forex, bonds and funds from a single integrated account.
Enjoy no hidden fees, no account minimums, and FX conversion rates as low as 0.03%, far better than what most brokers offer.
Sponsored ContentNew: Manage All Your Stock Portfolios in One Place
We've created the ultimate portfolio companion for stock investors, and it's free.
• Connect an unlimited number of Portfolios and see your total in one currency
• Be alerted to new Warning Signs or Risks via email or mobile
• Track the Fair Value of your stocks
Have feedback on this article? Concerned about the content? Get in touch with us directly. Alternatively, email editorial-team (at) simplywallst.com.
This article by Simply Wall St is general in nature. We provide commentary based on historical data and analyst forecasts only using an unbiased methodology and our articles are not intended to be financial advice. It does not constitute a recommendation to buy or sell any stock, and does not take account of your objectives, or your financial situation. We aim to bring you long-term focused analysis driven by fundamental data. Note that our analysis may not factor in the latest price-sensitive company announcements or qualitative material. Simply Wall St has no position in any stocks mentioned.
About SZSE:300890
Shanghai XFH Technology
Engages in the research and development, production, and sale of lithium battery anode materials in China.
Imperfect balance sheet very low.
Market Insights

Community Narratives

