- China
- /
- Aerospace & Defense
- /
- SZSE:300875
Tianjin Jieqiang Power Equipment Co.,Ltd.'s (SZSE:300875) 26% Price Boost Is Out Of Tune With Revenues


Tianjin Jieqiang Power Equipment Co.,Ltd. (SZSE:300875) shareholders are no doubt pleased to see that the share price has bounced 26% in the last month, although it is still struggling to make up recently lost ground. Not all shareholders will be feeling jubilant, since the share price is still down a very disappointing 25% in the last twelve months.
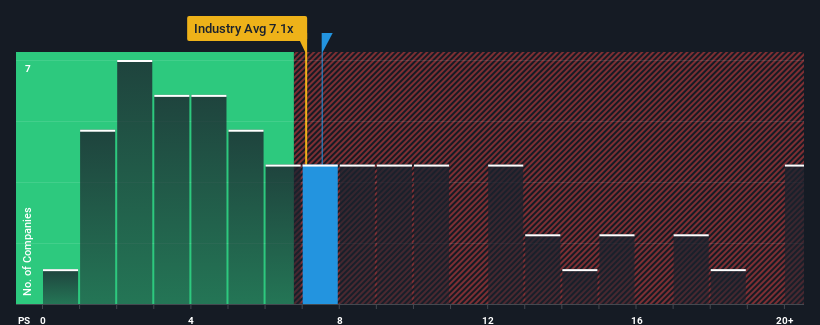
Even after such a large jump in price, you could still be forgiven for feeling indifferent about Tianjin Jieqiang Power EquipmentLtd's P/S ratio of 7.5x, since the median price-to-sales (or "P/S") ratio for the Aerospace & Defense industry in China is also close to 7.1x. While this might not raise any eyebrows, if the P/S ratio is not justified investors could be missing out on a potential opportunity or ignoring looming disappointment.
View our latest analysis for Tianjin Jieqiang Power EquipmentLtd
How Tianjin Jieqiang Power EquipmentLtd Has Been Performing
Recent times have been quite advantageous for Tianjin Jieqiang Power EquipmentLtd as its revenue has been rising very briskly. It might be that many expect the strong revenue performance to wane, which has kept the share price, and thus the P/S ratio, from rising. If that doesn't eventuate, then existing shareholders have reason to be feeling optimistic about the future direction of the share price.
We don't have analyst forecasts, but you can see how recent trends are setting up the company for the future by checking out our free report on Tianjin Jieqiang Power EquipmentLtd's earnings, revenue and cash flow.Do Revenue Forecasts Match The P/S Ratio?
The only time you'd be comfortable seeing a P/S like Tianjin Jieqiang Power EquipmentLtd's is when the company's growth is tracking the industry closely.
Retrospectively, the last year delivered an exceptional 141% gain to the company's top line. The latest three year period has also seen an excellent 37% overall rise in revenue, aided by its short-term performance. So we can start by confirming that the company has done a great job of growing revenue over that time.
Comparing that to the industry, which is predicted to deliver 48% growth in the next 12 months, the company's momentum is weaker, based on recent medium-term annualised revenue results.
In light of this, it's curious that Tianjin Jieqiang Power EquipmentLtd's P/S sits in line with the majority of other companies. Apparently many investors in the company are less bearish than recent times would indicate and aren't willing to let go of their stock right now. They may be setting themselves up for future disappointment if the P/S falls to levels more in line with recent growth rates.
The Key Takeaway
Tianjin Jieqiang Power EquipmentLtd appears to be back in favour with a solid price jump bringing its P/S back in line with other companies in the industry We'd say the price-to-sales ratio's power isn't primarily as a valuation instrument but rather to gauge current investor sentiment and future expectations.
Our examination of Tianjin Jieqiang Power EquipmentLtd revealed its poor three-year revenue trends aren't resulting in a lower P/S as per our expectations, given they look worse than current industry outlook. Right now we are uncomfortable with the P/S as this revenue performance isn't likely to support a more positive sentiment for long. Unless the recent medium-term conditions improve, it's hard to accept the current share price as fair value.
Plus, you should also learn about these 2 warning signs we've spotted with Tianjin Jieqiang Power EquipmentLtd.
If you're unsure about the strength of Tianjin Jieqiang Power EquipmentLtd's business, why not explore our interactive list of stocks with solid business fundamentals for some other companies you may have missed.
Valuation is complex, but we're here to simplify it.
Discover if Tianjin Jieqiang Power EquipmentLtd might be undervalued or overvalued with our detailed analysis, featuring fair value estimates, potential risks, dividends, insider trades, and its financial condition.
Access Free AnalysisHave feedback on this article? Concerned about the content? Get in touch with us directly. Alternatively, email editorial-team (at) simplywallst.com.
This article by Simply Wall St is general in nature. We provide commentary based on historical data and analyst forecasts only using an unbiased methodology and our articles are not intended to be financial advice. It does not constitute a recommendation to buy or sell any stock, and does not take account of your objectives, or your financial situation. We aim to bring you long-term focused analysis driven by fundamental data. Note that our analysis may not factor in the latest price-sensitive company announcements or qualitative material. Simply Wall St has no position in any stocks mentioned.
About SZSE:300875
Tianjin Jieqiang Power EquipmentLtd
Tianjin Jieqiang Power Equipment Co.,Ltd.
Excellent balance sheet minimal.
Market Insights

Community Narratives


