
Advertisement
- China
- /
- Electrical
- /
- SZSE:300602
Investors Still Aren't Entirely Convinced By Shenzhen FRD Science & Technology Co., Ltd.'s (SZSE:300602) Revenues Despite 34% Price Jump
Shenzhen FRD Science & Technology Co., Ltd. (SZSE:300602) shareholders are no doubt pleased to see that the share price has bounced 34% in the last month, although it is still struggling to make up recently lost ground. The bad news is that even after the stocks recovery in the last 30 days, shareholders are still underwater by about 6.7% over the last year.
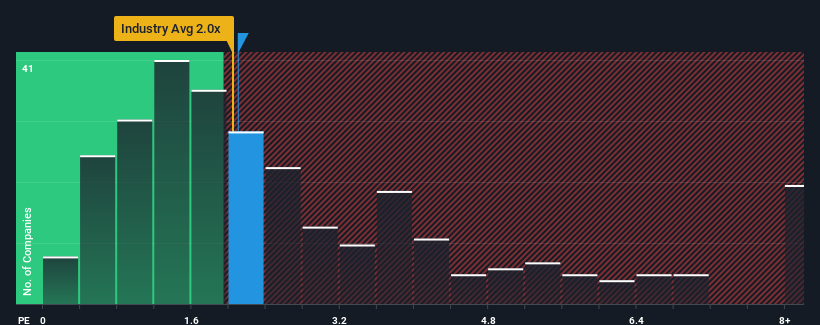
In spite of the firm bounce in price, there still wouldn't be many who think Shenzhen FRD Science & Technology's price-to-sales (or "P/S") ratio of 2.1x is worth a mention when the median P/S in China's Electrical industry is similar at about 2x. However, investors might be overlooking a clear opportunity or potential setback if there is no rational basis for the P/S.
See our latest analysis for Shenzhen FRD Science & Technology
What Does Shenzhen FRD Science & Technology's P/S Mean For Shareholders?
With revenue growth that's inferior to most other companies of late, Shenzhen FRD Science & Technology has been relatively sluggish. It might be that many expect the uninspiring revenue performance to strengthen positively, which has kept the P/S ratio from falling. You'd really hope so, otherwise you're paying a relatively elevated price for a company with this sort of growth profile.
Want the full picture on analyst estimates for the company? Then our free report on Shenzhen FRD Science & Technology will help you uncover what's on the horizon.What Are Revenue Growth Metrics Telling Us About The P/S?
Shenzhen FRD Science & Technology's P/S ratio would be typical for a company that's only expected to deliver moderate growth, and importantly, perform in line with the industry.
Retrospectively, the last year delivered a decent 10% gain to the company's revenues. This was backed up an excellent period prior to see revenue up by 33% in total over the last three years. Therefore, it's fair to say the revenue growth recently has been superb for the company.
Looking ahead now, revenue is anticipated to climb by 51% during the coming year according to the one analyst following the company. That's shaping up to be materially higher than the 27% growth forecast for the broader industry.
With this information, we find it interesting that Shenzhen FRD Science & Technology is trading at a fairly similar P/S compared to the industry. It may be that most investors aren't convinced the company can achieve future growth expectations.
The Bottom Line On Shenzhen FRD Science & Technology's P/S
Shenzhen FRD Science & Technology's stock has a lot of momentum behind it lately, which has brought its P/S level with the rest of the industry. Generally, our preference is to limit the use of the price-to-sales ratio to establishing what the market thinks about the overall health of a company.
Despite enticing revenue growth figures that outpace the industry, Shenzhen FRD Science & Technology's P/S isn't quite what we'd expect. There could be some risks that the market is pricing in, which is preventing the P/S ratio from matching the positive outlook. At least the risk of a price drop looks to be subdued, but investors seem to think future revenue could see some volatility.
It is also worth noting that we have found 3 warning signs for Shenzhen FRD Science & Technology that you need to take into consideration.
If these risks are making you reconsider your opinion on Shenzhen FRD Science & Technology, explore our interactive list of high quality stocks to get an idea of what else is out there.
New: Manage All Your Stock Portfolios in One Place
We've created the ultimate portfolio companion for stock investors, and it's free.
• Connect an unlimited number of Portfolios and see your total in one currency
• Be alerted to new Warning Signs or Risks via email or mobile
• Track the Fair Value of your stocks
Have feedback on this article? Concerned about the content? Get in touch with us directly. Alternatively, email editorial-team (at) simplywallst.com.
This article by Simply Wall St is general in nature. We provide commentary based on historical data and analyst forecasts only using an unbiased methodology and our articles are not intended to be financial advice. It does not constitute a recommendation to buy or sell any stock, and does not take account of your objectives, or your financial situation. We aim to bring you long-term focused analysis driven by fundamental data. Note that our analysis may not factor in the latest price-sensitive company announcements or qualitative material. Simply Wall St has no position in any stocks mentioned.
About SZSE:300602
Shenzhen FRD Science & Technology
Shenzhen FRD Science & Technology Co., Ltd.
Solid track record with excellent balance sheet.
Similar Companies
Market Insights

Advertisement
Community Narratives
MicroVision will explode future revenue by 380.37% with a vision towards success
Fair Value US$60.00|98.4% undervalued
TH
Community Contributor
The Indispensable Artery for a New North American Economy
Fair Value CA$132.87|1.3% undervalued
TI
Community Contributor