
Advertisement
There's No Escaping Shandong Longertek Technology Co., Ltd.'s (SZSE:300594) Muted Revenues Despite A 39% Share Price Rise

Those holding Shandong Longertek Technology Co., Ltd. (SZSE:300594) shares would be relieved that the share price has rebounded 39% in the last thirty days, but it needs to keep going to repair the recent damage it has caused to investor portfolios. Not all shareholders will be feeling jubilant, since the share price is still down a very disappointing 27% in the last twelve months.
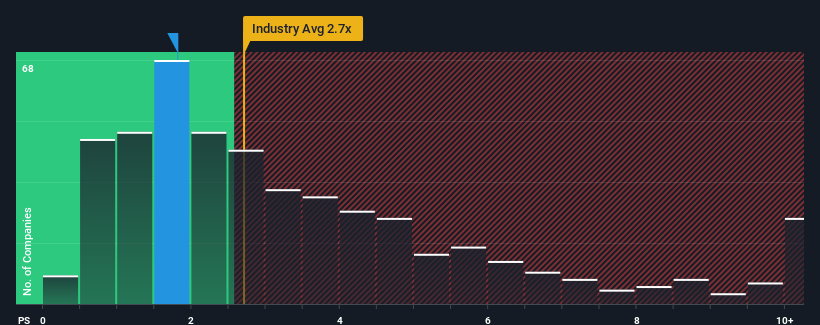
Even after such a large jump in price, Shandong Longertek Technology's price-to-sales (or "P/S") ratio of 1.8x might still make it look like a buy right now compared to the Machinery industry in China, where around half of the companies have P/S ratios above 2.7x and even P/S above 5x are quite common. Although, it's not wise to just take the P/S at face value as there may be an explanation why it's limited.
See our latest analysis for Shandong Longertek Technology
How Shandong Longertek Technology Has Been Performing
Shandong Longertek Technology has been doing a decent job lately as it's been growing revenue at a reasonable pace. It might be that many expect the respectable revenue performance to degrade, which has repressed the P/S. Those who are bullish on Shandong Longertek Technology will be hoping that this isn't the case, so that they can pick up the stock at a lower valuation.
Although there are no analyst estimates available for Shandong Longertek Technology, take a look at this free data-rich visualisation to see how the company stacks up on earnings, revenue and cash flow.Do Revenue Forecasts Match The Low P/S Ratio?
The only time you'd be truly comfortable seeing a P/S as low as Shandong Longertek Technology's is when the company's growth is on track to lag the industry.
If we review the last year of revenue growth, the company posted a worthy increase of 6.1%. The latest three year period has also seen an excellent 49% overall rise in revenue, aided somewhat by its short-term performance. Therefore, it's fair to say the revenue growth recently has been superb for the company.
Comparing that to the industry, which is predicted to deliver 27% growth in the next 12 months, the company's momentum is weaker, based on recent medium-term annualised revenue results.
With this in consideration, it's easy to understand why Shandong Longertek Technology's P/S falls short of the mark set by its industry peers. Apparently many shareholders weren't comfortable holding on to something they believe will continue to trail the wider industry.
What We Can Learn From Shandong Longertek Technology's P/S?
Shandong Longertek Technology's stock price has surged recently, but its but its P/S still remains modest. We'd say the price-to-sales ratio's power isn't primarily as a valuation instrument but rather to gauge current investor sentiment and future expectations.
As we suspected, our examination of Shandong Longertek Technology revealed its three-year revenue trends are contributing to its low P/S, given they look worse than current industry expectations. At this stage investors feel the potential for an improvement in revenue isn't great enough to justify a higher P/S ratio. Unless the recent medium-term conditions improve, they will continue to form a barrier for the share price around these levels.
There are also other vital risk factors to consider before investing and we've discovered 2 warning signs for Shandong Longertek Technology that you should be aware of.
It's important to make sure you look for a great company, not just the first idea you come across. So if growing profitability aligns with your idea of a great company, take a peek at this free list of interesting companies with strong recent earnings growth (and a low P/E).
New: Manage All Your Stock Portfolios in One Place
We've created the ultimate portfolio companion for stock investors, and it's free.
• Connect an unlimited number of Portfolios and see your total in one currency
• Be alerted to new Warning Signs or Risks via email or mobile
• Track the Fair Value of your stocks
Have feedback on this article? Concerned about the content? Get in touch with us directly. Alternatively, email editorial-team (at) simplywallst.com.
This article by Simply Wall St is general in nature. We provide commentary based on historical data and analyst forecasts only using an unbiased methodology and our articles are not intended to be financial advice. It does not constitute a recommendation to buy or sell any stock, and does not take account of your objectives, or your financial situation. We aim to bring you long-term focused analysis driven by fundamental data. Note that our analysis may not factor in the latest price-sensitive company announcements or qualitative material. Simply Wall St has no position in any stocks mentioned.
About SZSE:300594
Shandong Longertek Technology
Engages in the research, development, production, sale, and maintenance of rail transit vehicle air conditioners and their control systems in China and internationally.
Mediocre balance sheet and slightly overvalued.
Market Insights

Advertisement
Community Narratives

BMW cruising ahead with new EVs and premium models to boost revenue 5%
Fair Value €135.07|44.6% undervalued
UN
Community Contributor
EU#2 - From Humble Beginnings to Global Powerhouse
Fair Value DKK 851.04|46.4% undervalued
TO
Community Contributor