
Advertisement
Shenzhen Liande Automation Equipment co.,ltd. (SZSE:300545) Stocks Shoot Up 34% But Its P/E Still Looks Reasonable

Those holding Shenzhen Liande Automation Equipment co.,ltd. (SZSE:300545) shares would be relieved that the share price has rebounded 34% in the last thirty days, but it needs to keep going to repair the recent damage it has caused to investor portfolios. Looking back a bit further, it's encouraging to see the stock is up 36% in the last year.
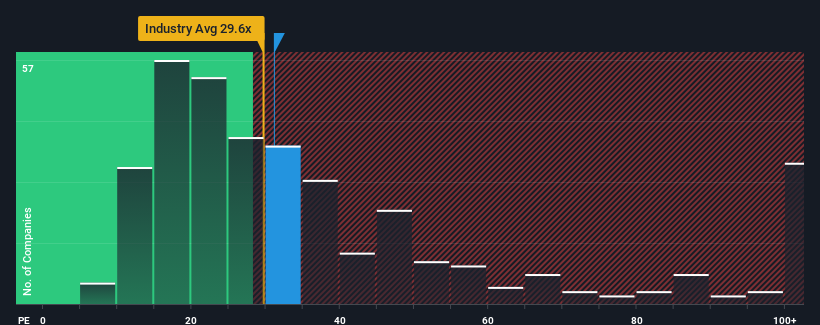
In spite of the firm bounce in price, it's still not a stretch to say that Shenzhen Liande Automation Equipmentltd's price-to-earnings (or "P/E") ratio of 31.1x right now seems quite "middle-of-the-road" compared to the market in China, where the median P/E ratio is around 30x. While this might not raise any eyebrows, if the P/E ratio is not justified investors could be missing out on a potential opportunity or ignoring looming disappointment.
With its earnings growth in positive territory compared to the declining earnings of most other companies, Shenzhen Liande Automation Equipmentltd has been doing quite well of late. One possibility is that the P/E is moderate because investors think the company's earnings will be less resilient moving forward. If not, then existing shareholders have reason to be feeling optimistic about the future direction of the share price.
See our latest analysis for Shenzhen Liande Automation Equipmentltd
What Are Growth Metrics Telling Us About The P/E?
The only time you'd be comfortable seeing a P/E like Shenzhen Liande Automation Equipmentltd's is when the company's growth is tracking the market closely.
Taking a look back first, we see that the company grew earnings per share by an impressive 231% last year. Pleasingly, EPS has also lifted 72% in aggregate from three years ago, thanks to the last 12 months of growth. Accordingly, shareholders would have probably welcomed those medium-term rates of earnings growth.
Turning to the outlook, the next year should generate growth of 40% as estimated by the one analyst watching the company. With the market predicted to deliver 41% growth , the company is positioned for a comparable earnings result.
In light of this, it's understandable that Shenzhen Liande Automation Equipmentltd's P/E sits in line with the majority of other companies. It seems most investors are expecting to see average future growth and are only willing to pay a moderate amount for the stock.
The Key Takeaway
Shenzhen Liande Automation Equipmentltd appears to be back in favour with a solid price jump getting its P/E back in line with most other companies. It's argued the price-to-earnings ratio is an inferior measure of value within certain industries, but it can be a powerful business sentiment indicator.
As we suspected, our examination of Shenzhen Liande Automation Equipmentltd's analyst forecasts revealed that its market-matching earnings outlook is contributing to its current P/E. Right now shareholders are comfortable with the P/E as they are quite confident future earnings won't throw up any surprises. It's hard to see the share price moving strongly in either direction in the near future under these circumstances.
Many other vital risk factors can be found on the company's balance sheet. You can assess many of the main risks through our free balance sheet analysis for Shenzhen Liande Automation Equipmentltd with six simple checks.
It's important to make sure you look for a great company, not just the first idea you come across. So take a peek at this free list of interesting companies with strong recent earnings growth (and a low P/E).
New: Manage All Your Stock Portfolios in One Place
We've created the ultimate portfolio companion for stock investors, and it's free.
• Connect an unlimited number of Portfolios and see your total in one currency
• Be alerted to new Warning Signs or Risks via email or mobile
• Track the Fair Value of your stocks
Have feedback on this article? Concerned about the content? Get in touch with us directly. Alternatively, email editorial-team (at) simplywallst.com.
This article by Simply Wall St is general in nature. We provide commentary based on historical data and analyst forecasts only using an unbiased methodology and our articles are not intended to be financial advice. It does not constitute a recommendation to buy or sell any stock, and does not take account of your objectives, or your financial situation. We aim to bring you long-term focused analysis driven by fundamental data. Note that our analysis may not factor in the latest price-sensitive company announcements or qualitative material. Simply Wall St has no position in any stocks mentioned.
About SZSE:300545
Shenzhen Liande Automation Equipmentltd
Shenzhen Liande Automation Equipment co.,ltd.
Flawless balance sheet with proven track record.
Market Insights


Advertisement
Community Narratives
Suncorp’s Next Chapter: Insurance-Only and Ready to Grow
Fair Value AU$22.83|5.7% undervalued
RO
Community Contributor
Thyssenkrupp Nucera Will Achieve Double-Digit Profits by 2030 Boosted by Hydrogen Growth
Fair Value €14.40|31.6% undervalued
CH
Community Contributor
Tesla’s Nvidia Moment – The AI & Robotics Inflection Point
Fair Value US$384.84|21.9% undervalued
BL
Community Contributor